OLAP - Cash Flow & Burn Analysis
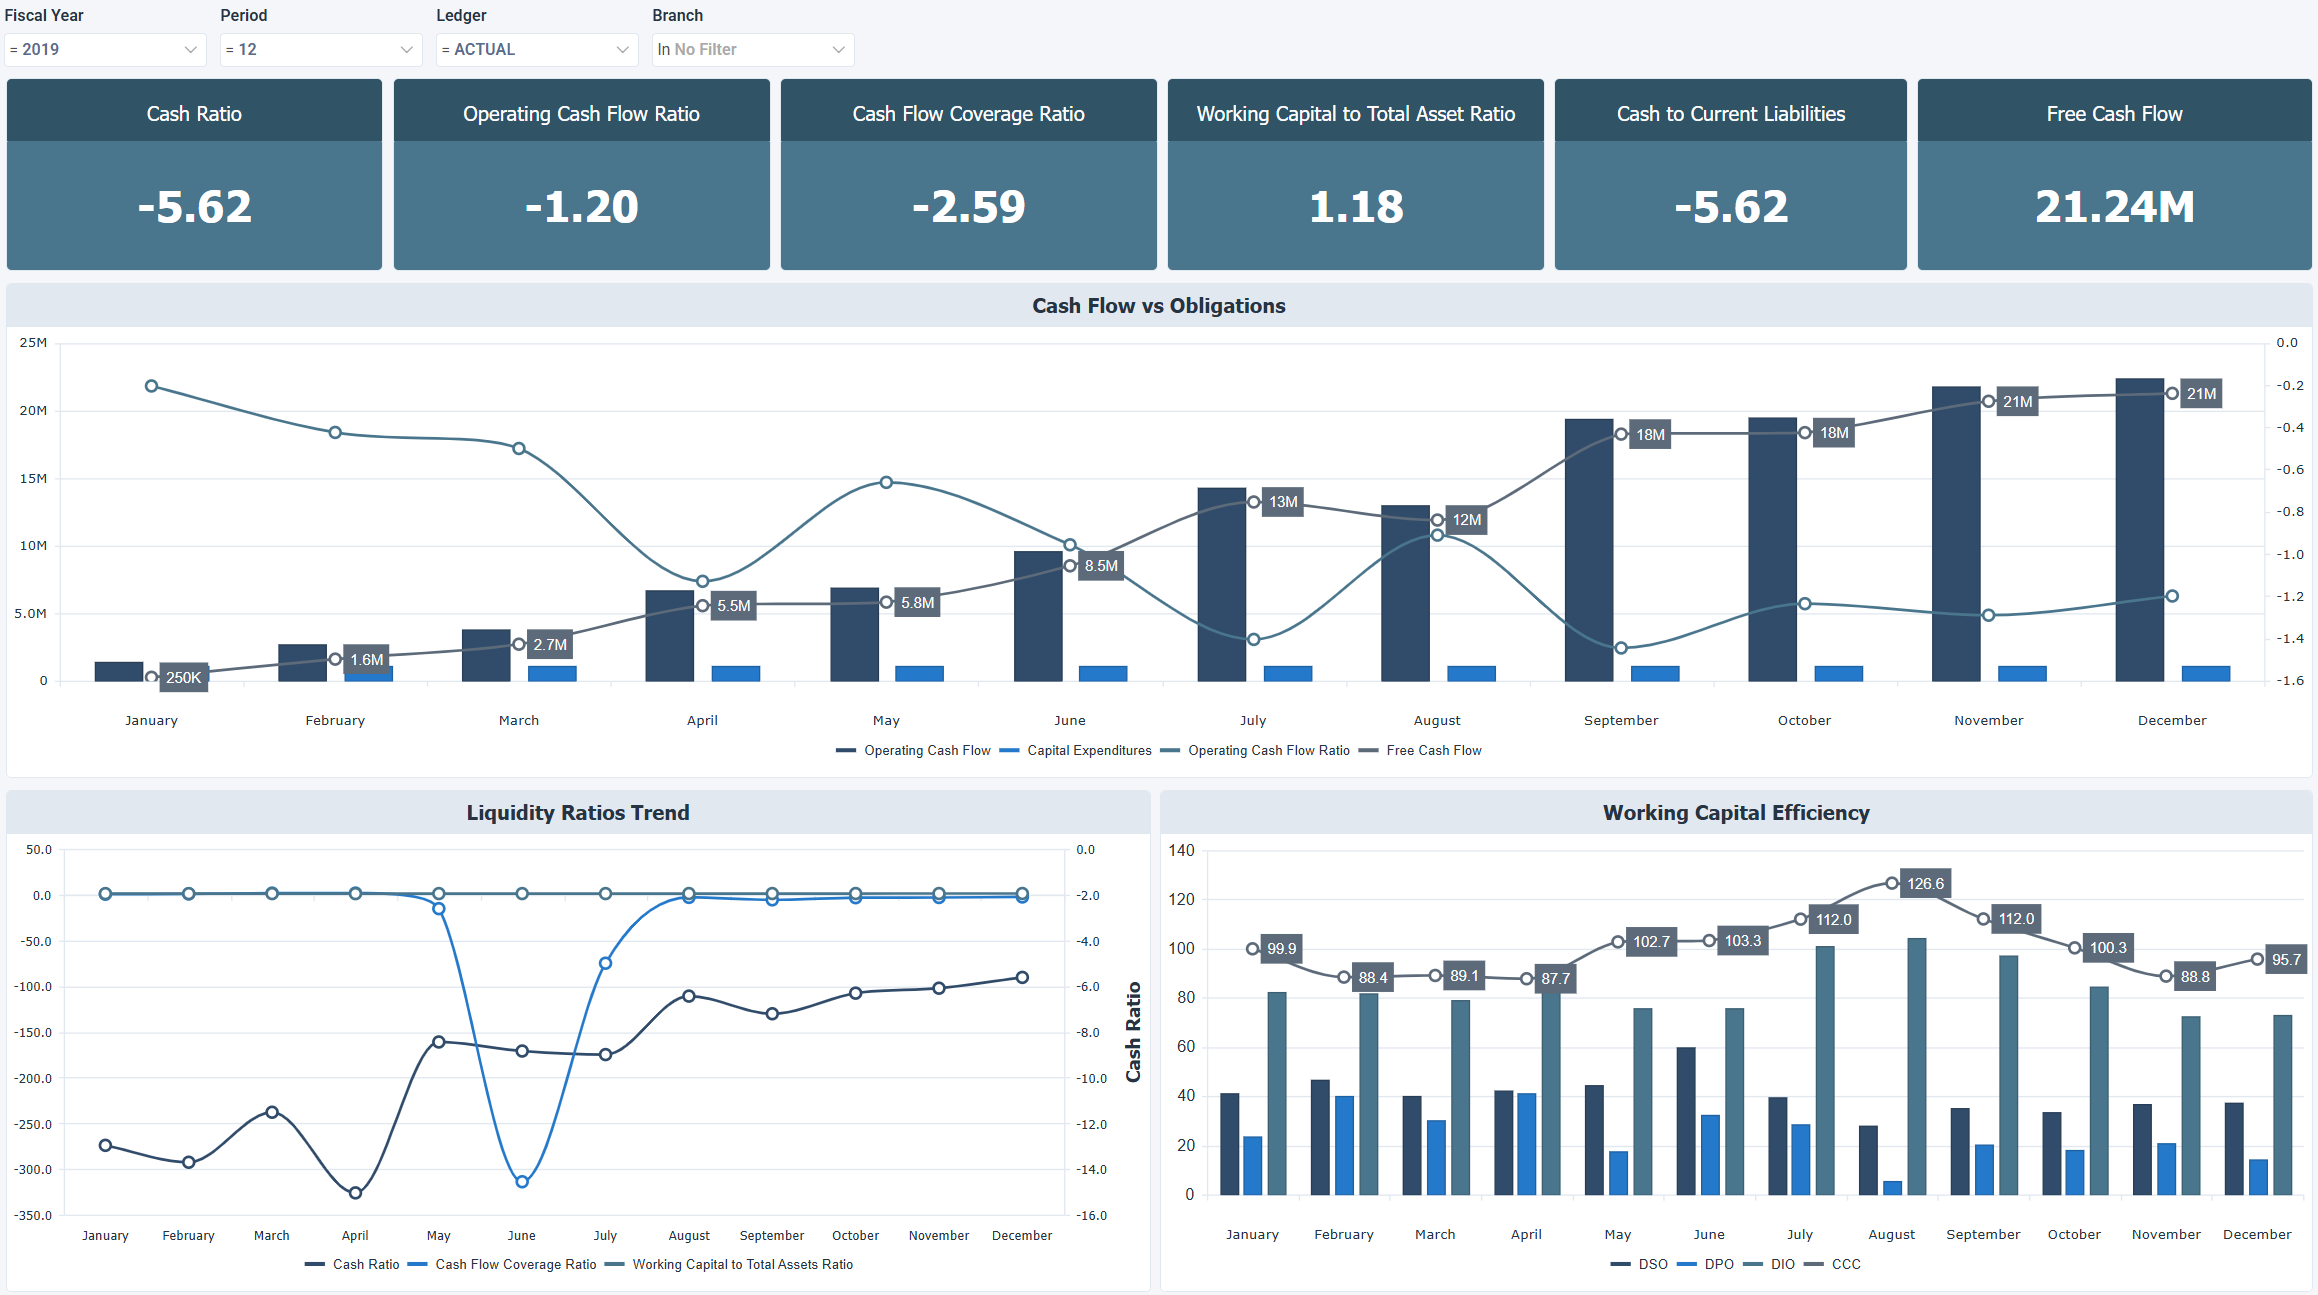
The OLAP - Cash Flow & Burn Analysis dashboard provides a detailed view of liquidity strength, cash generation capacity, and the organization’s ability to sustain operations through internally generated funds. It helps finance leaders monitor operating cash performance, capital intensity, leverage coverage, and short-term solvency on a monthly basis.
Benefits of this dashboard
- Manage liquidity risk proactively: Identifies short‑term liquidity constraints early to help prevent operational cash shortfalls.
- Monitor operational cash performance: Shows how effectively core operations convert revenue into usable cash.
- Oversee capital allocation: Clarifies the impact of capital expenditures on free cash flow to support informed investment decisions.
- Optimize working capital: Highlights efficiency trends to improve cash conversion and strengthen operational funding capacity.
- Assess debt servicing and financial stability: Helps executives evaluate the organization’s ability to meet obligations without relying on external financing.
Key performance indicators
| KPI | Description |
|---|---|
| Cash Ratio | Ability to cover current liabilities using only cash and cash equivalents. Higher values indicate stronger immediate liquidity and lower short-term risk, while lower values indicate greater reliance on converting other short-term assets to meet obligations. |
| Operating Cash Flow Ratio | Proportion of current liabilities covered by operating cash flow. Higher values indicate stronger operating cash generation relative to short-term obligations, while lower values indicate tighter operating liquidity. |
| Cash Flow Coverage Ratio | Ability to service total obligations using operating cash flow. Higher values indicate greater debt-servicing capacity and lower financial risk, while lower values indicate greater dependence on external financing. |
| Working Capital to Total Asset Ratio | Proportion of total assets financed by net working capital. Higher values indicate stronger short-term financial stability and operational resilience, while lower values indicate tighter liquidity relative to the asset base. |
| Cash to Current Liabilities | Extent to which current liabilities are covered by available cash. Higher values indicate stronger short-term solvency and lower default risk, while lower values indicate potential liquidity pressure. |
| Free Cash Flow | Cash generated from operations after capital expenditures. Higher values indicate greater flexibility for debt repayment, reinvestment, and shareholder returns, while lower or negative values indicate constrained cash availability. |
Example dashboard
Filters
Use the filtering panel at the top of the dashboard to control which data is shown. The filters apply to all views and ensure the dashboard reflects the selections you choose.
- Fiscal Year
- Period
- Ledger
- Branch