OLAP - Executive Sales & Profit Summary
The OLAP - Executive Sales & Profit Summary dashboard provides a high-level view of financial performance focused on revenue, cost structure, and profitability. It helps executive leadership monitor sales performance, operating efficiency, and earnings over time and across organizational dimensions to support strategic and financial decisions.
Benefits of this dashboard
- Strengthen executive revenue oversight: Provides a consolidated view of commercial performance to support strategic sales planning and reporting.
- Identify growth and decline quickly: Uses year‑over‑year variance analysis to reveal revenue acceleration or contraction.
- Monitor margin sustainability: Tracks changes in margin structure alongside revenue growth to support profitability governance.
- Evaluate sales force effectiveness: Highlights top‑performing sales representatives to guide incentives and resource allocation.
- Analyze customer and product concentration: Identifies dependency on key customers and products to manage commercial risk and diversification strategy.
Key performance indicators
| KPI | Description |
|---|---|
| Revenue | Total sales value generated during the selected period. Reflects overall demand and market performance. |
| Cost of Goods Sold | Direct costs attributable to goods sold. Indicates production and purchasing cost levels relative to revenue. |
| Gross Profit | Difference between revenue and COGS. Indicates profitability from core operations before operating expenses. |
| Operating Expense | Total indirect costs to run the business, including administrative and overhead expenses. Indicates overhead impact on profitability. |
| EBIT | Earnings before interest and taxes. Indicates operating profitability excluding financing and tax impacts. |
| Net Income | Profit or loss after all expenses, interest, and taxes. Indicates overall profitability for the selected period. |
Example dashboard
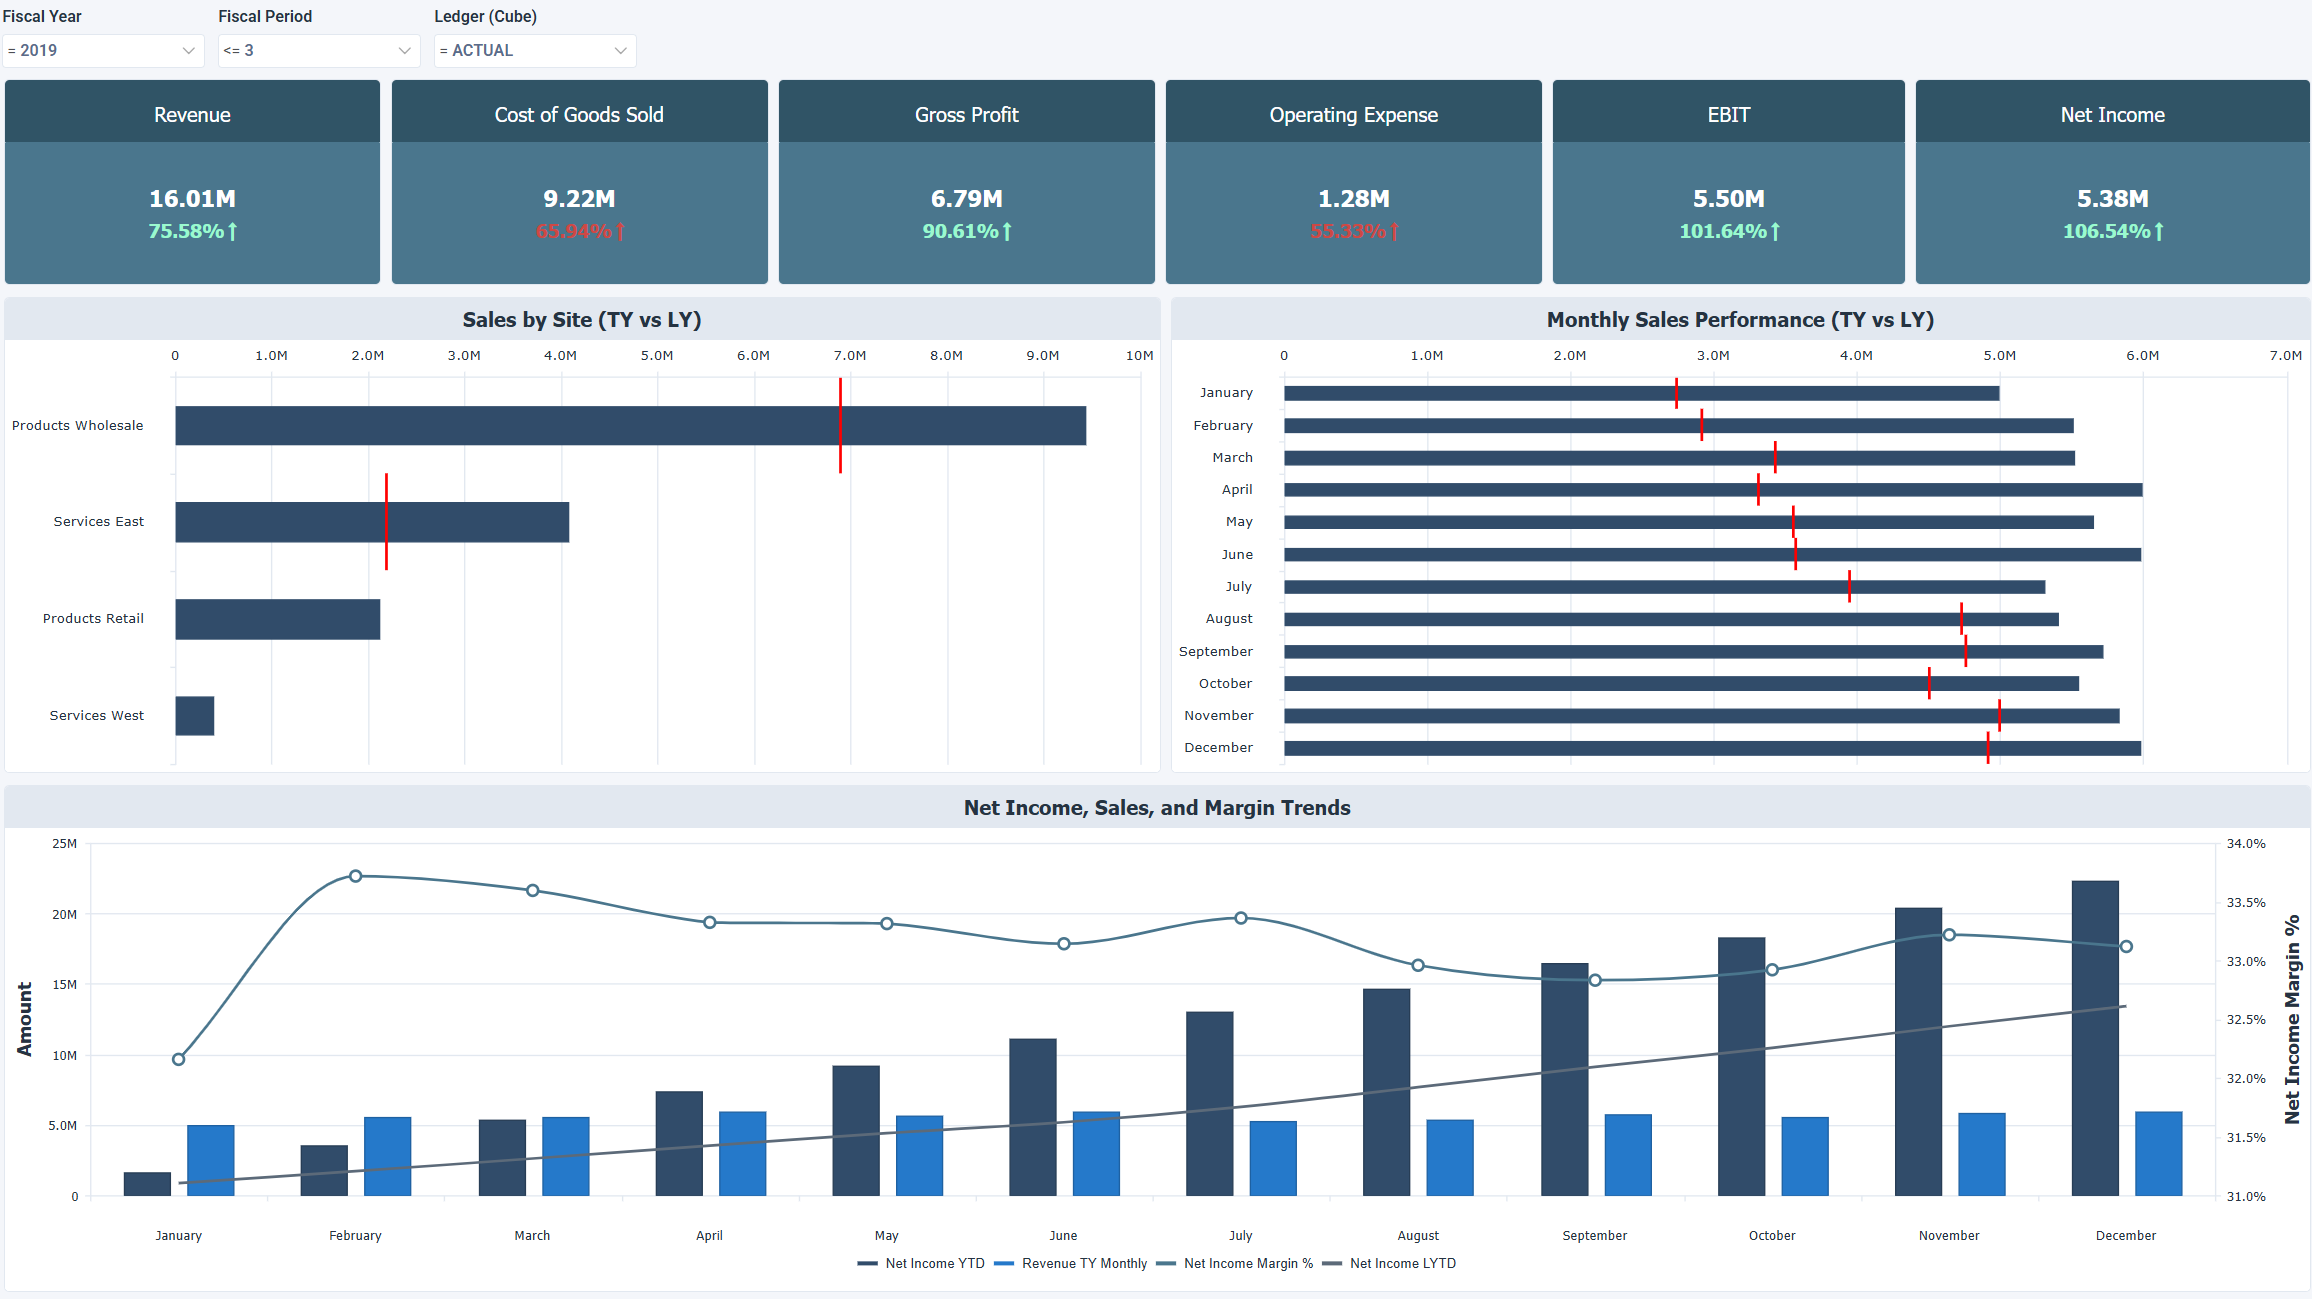
Filters
Use the filtering panel at the top of the dashboard to control which data is shown. The filters apply to all views and ensure the dashboard reflects the selections you choose.
- Fiscal Year
- Fiscal Period
- Ledger (Cube)