The AR and AP (Accounts Receivable and Accounts Payable) dashboard provides visibility into outstanding receivables and payables, overdue balances, and cash flow trends. It helps finance teams manage liquidity, prioritize collections, and monitor payment obligations.
Benefits of this dashboard
- Increase cash‑flow visibility: Shows cash inflows and outflows to support effective liquidity planning.
- Prioritize collections: Highlights overdue receivables to focus and accelerate collection efforts.
- Strengthen payables oversight: Tracks outstanding payables to help manage supplier payments and maintain vendor relationships.
- Provide financial performance context: Connects AR and AP activity with income, expense, and profit trends for a clearer financial picture.
- Optimize liquidity: Supports balancing receivables and payables to maintain a healthy cash position.
Receivable Overdue vs Total
| Metric | Description |
|---|
| Overdue Total HC | Overdue receivable amount in the home currency. |
| Due Amount HC | Total receivable amount due in the home currency. |
Payable Overdue vs Total
| Metric | Description |
|---|
| Overdue Total HC | Overdue payable amount in the home currency. |
| Amount Due HC | Total payable amount due in the home currency. |
Visual components
| Title | View type | Description |
|---|
| Aging Receivable | Vertical Bar | Breakdown of outstanding customer balances by aging period (current, 1–30 days, 31–60 days, etc.). |
| Aging Payable | Vertical Bar | Breakdown of outstanding vendor balances by aging period. |
| Top 10 Customers AR Due | Stacked Bar | Shows customers with the highest outstanding receivables, grouped by aging period. |
| Cash Flow - Rolling 12 Months | Combination | Tracks cash inflows and outflows over the past 12 months. |
| Income and Expenses | Combination | Compares income, expenses, and profit by month. |
| Top 10 Vendors AP Due | Stacked Bar | Shows vendors with the highest outstanding payables. |
Example dashboard
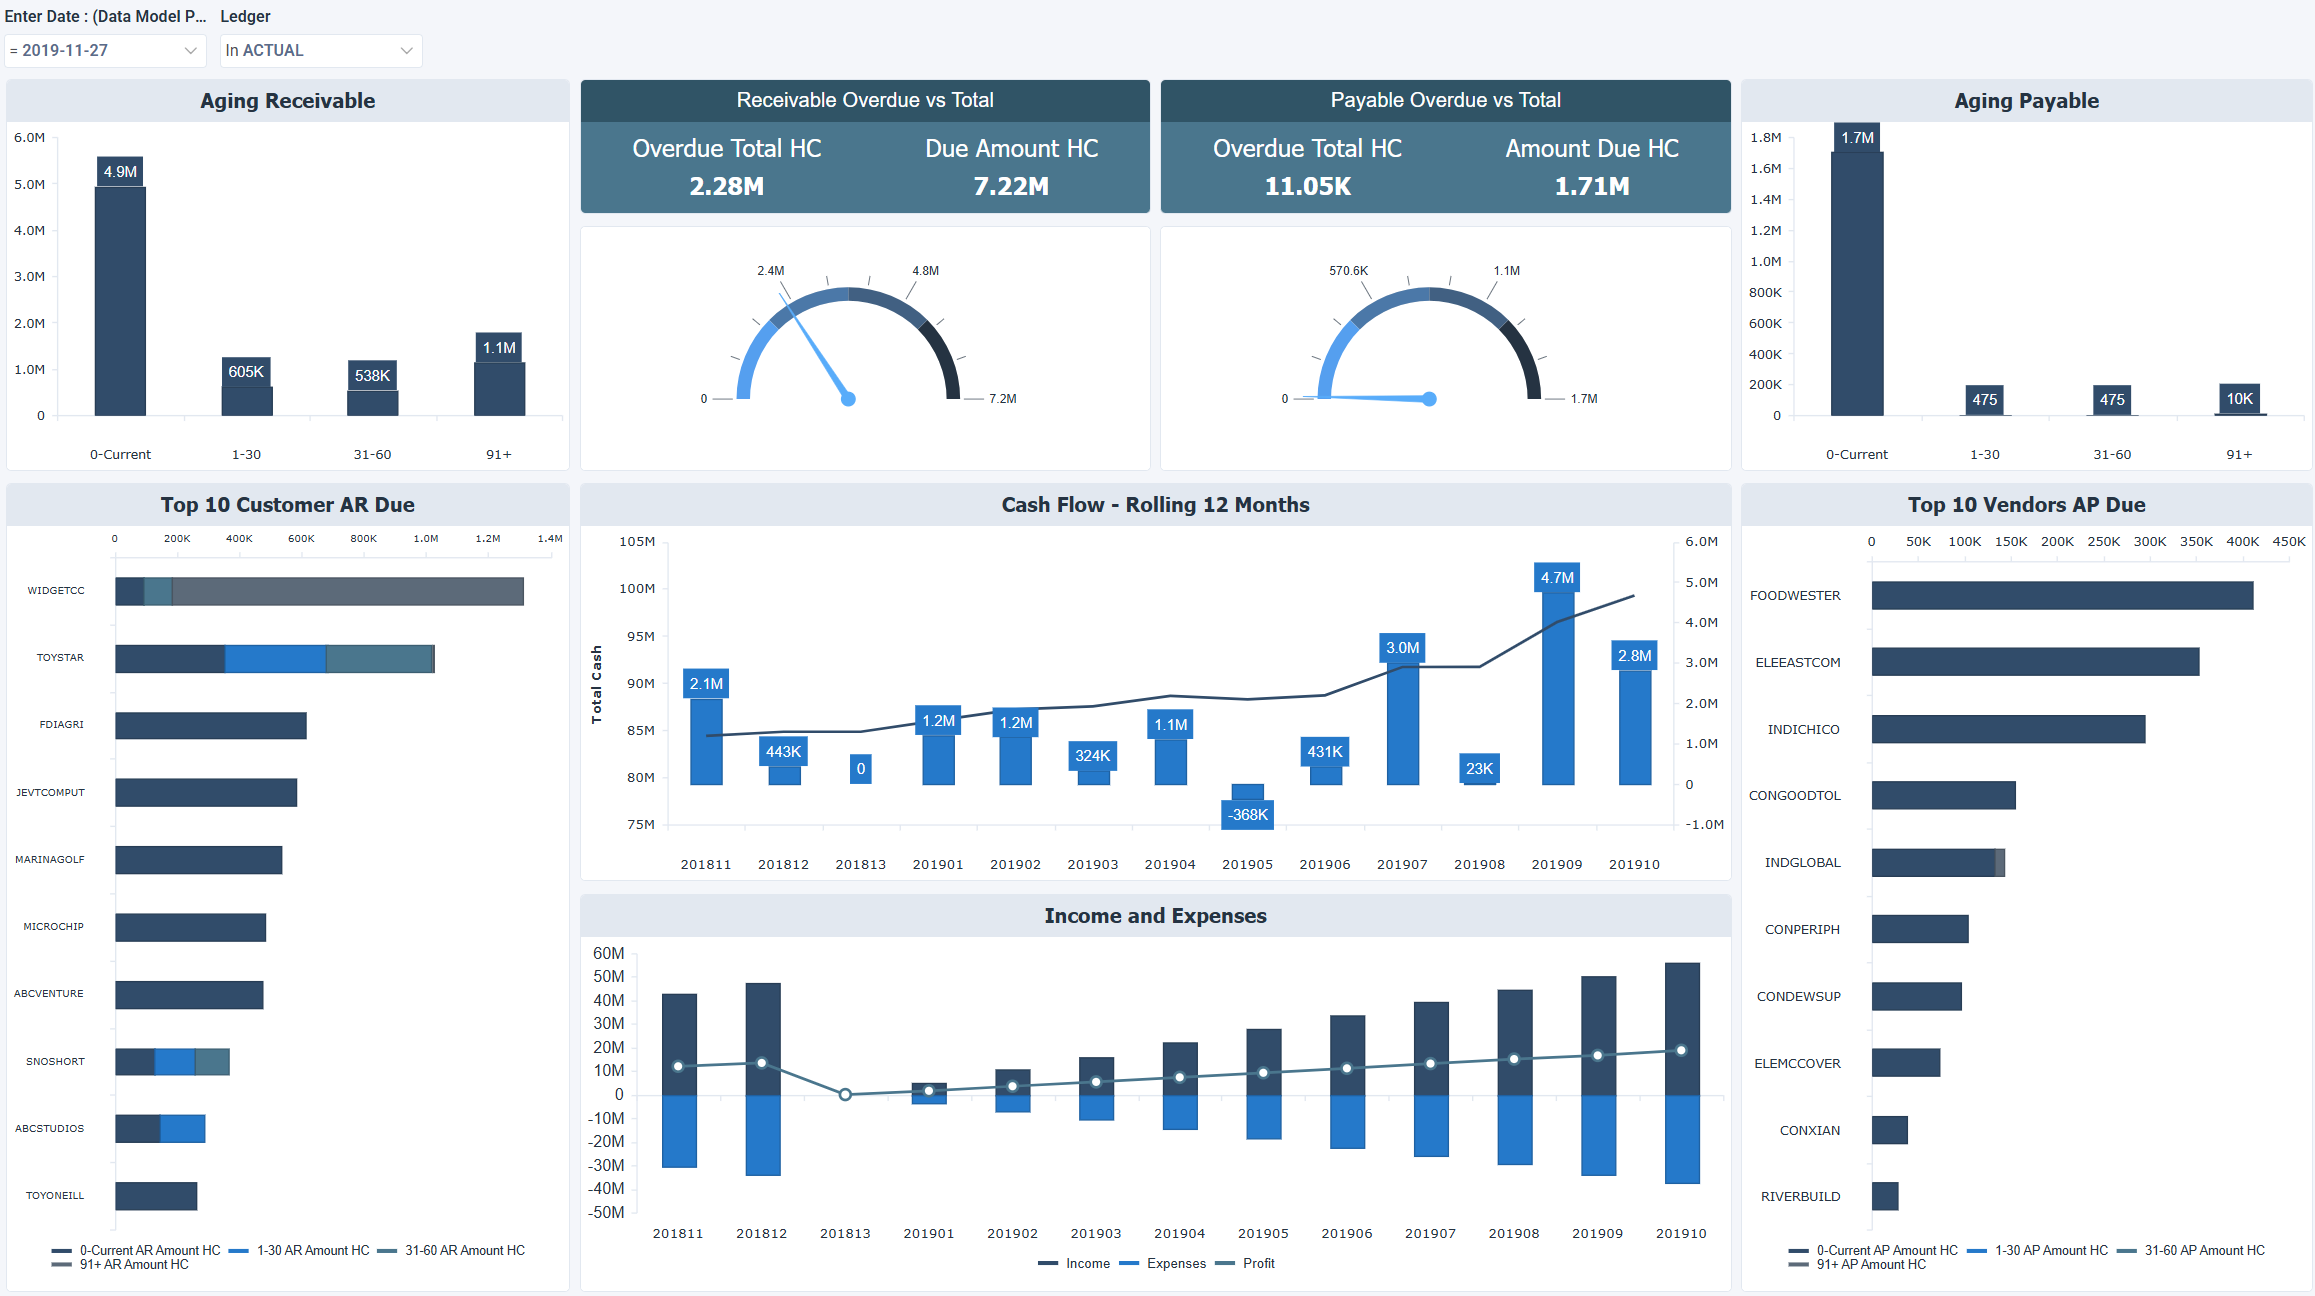
Filters
Use the filtering panel at the top of the dashboard to control which data is shown. The filters apply to all views and ensure the dashboard reflects the selections you choose.