OLAP - Executive Sales Summary - TY vs LY
The OLAP - Executive Sales Summary - TY vs LY dashboard provides a high-level view of sales performance, year-over-year growth, and commercial concentration across customers, products, and sales representatives. It helps executive leaders evaluate revenue momentum, margin performance, volume impact, and reliance on top contributors to support strategic sales decisions.
Benefits of this dashboard
- Strengthen executive performance visibility: Provides a consolidated view of sales and margin performance to support leadership reporting and planning.
- Reveal year‑over‑year variance patterns: Shows where revenue is accelerating or declining through direct comparisons between this year and last year.
- Monitor margin sustainability: Tracks margin changes alongside revenue to support profitability governance.
- Evaluate sales‑force effectiveness: Highlights top-performing sales representatives to support incentives and resource allocation.
- Increase concentration awareness: Identifies reliance on key customers and products to support diversification and risk management.
Key performance indicators
| KPI | Description |
|---|---|
| Net Sales Current Year | Total recognized sales revenue for the selected fiscal period in the current year. Higher values indicate stronger current-period performance, while lower values indicate revenue contraction or weaker demand. |
| Net Sales Last Year | Total recognized sales revenue for the equivalent period in the prior year. Provides a baseline for year-over-year analysis. |
| Net Sales Variance | Percentage change in net sales between the current year and the prior year. Higher positive values indicate revenue growth, while negative values indicate declining sales performance. |
| Margin % Current Year | Gross margin in the current year as a percentage of net sales. Higher values indicate stronger pricing power and cost efficiency, while lower values indicate margin pressure from cost increases or pricing erosion. |
| Margin Variance % | Year-over-year percentage change in gross margin. Positive values indicate improving profitability, while negative values indicate margin deterioration. |
| Quantity Variance % | Year-over-year percentage change in sales volume. Higher values indicate volume-driven growth, while negative values indicate declining unit demand. |
Example dashboard
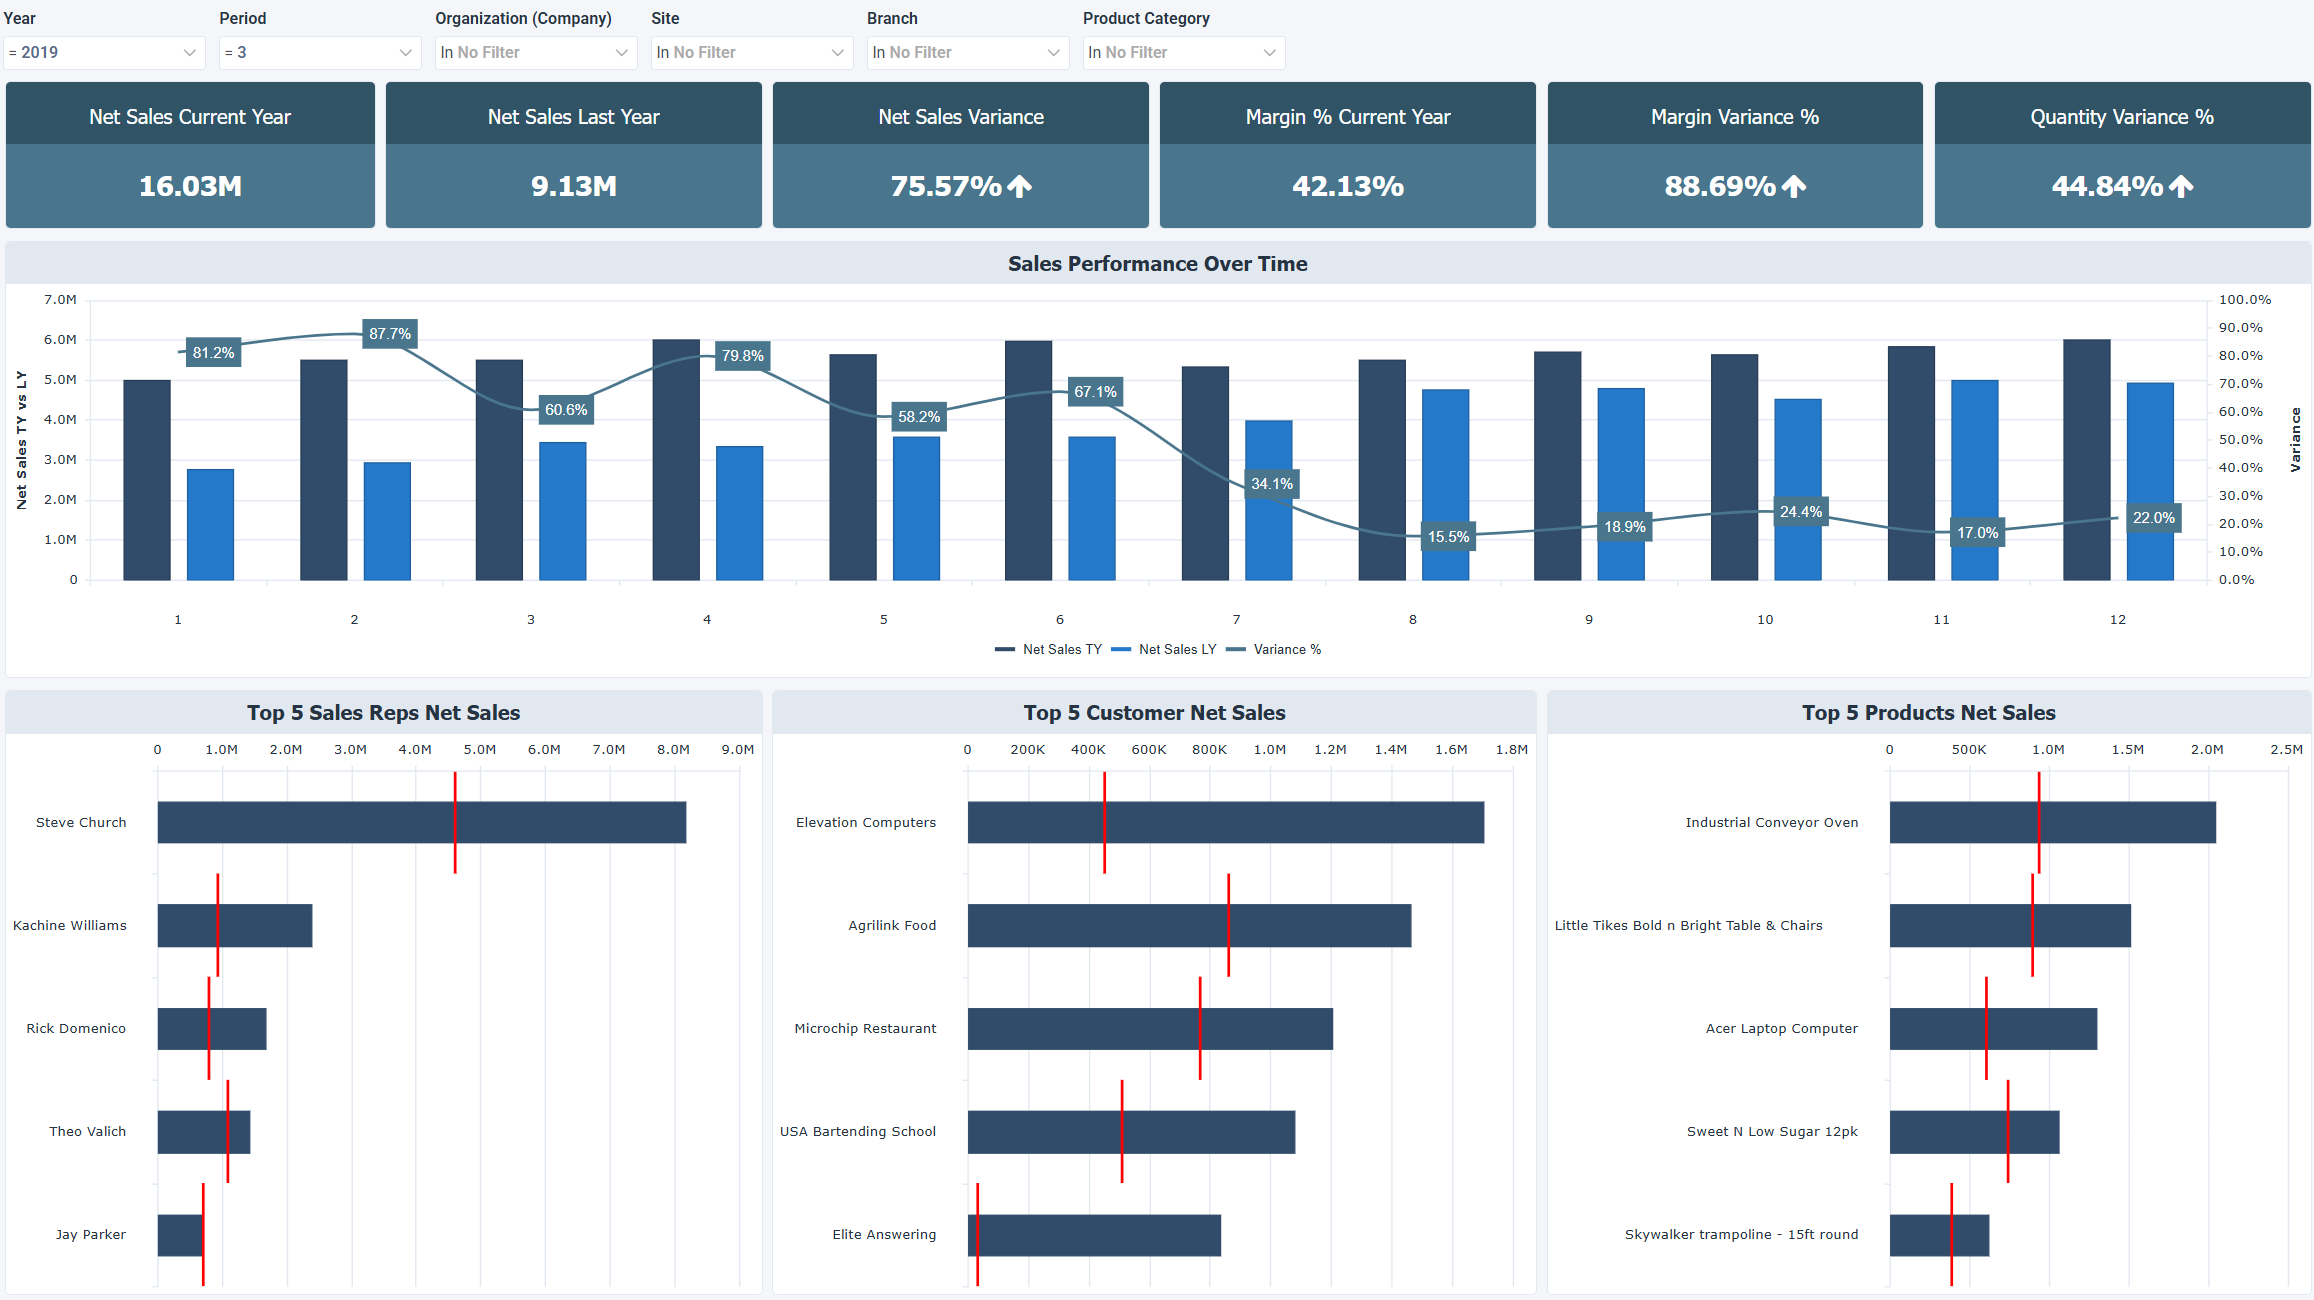
Filters
Use the filtering panel at the top of the dashboard to control which data is shown. The filters apply to all views and ensure the dashboard reflects the selections you choose.
- Year
- Period
- Company
- Site
- Branch
- Product Category