OLAP - CFO Financial Performance Overview
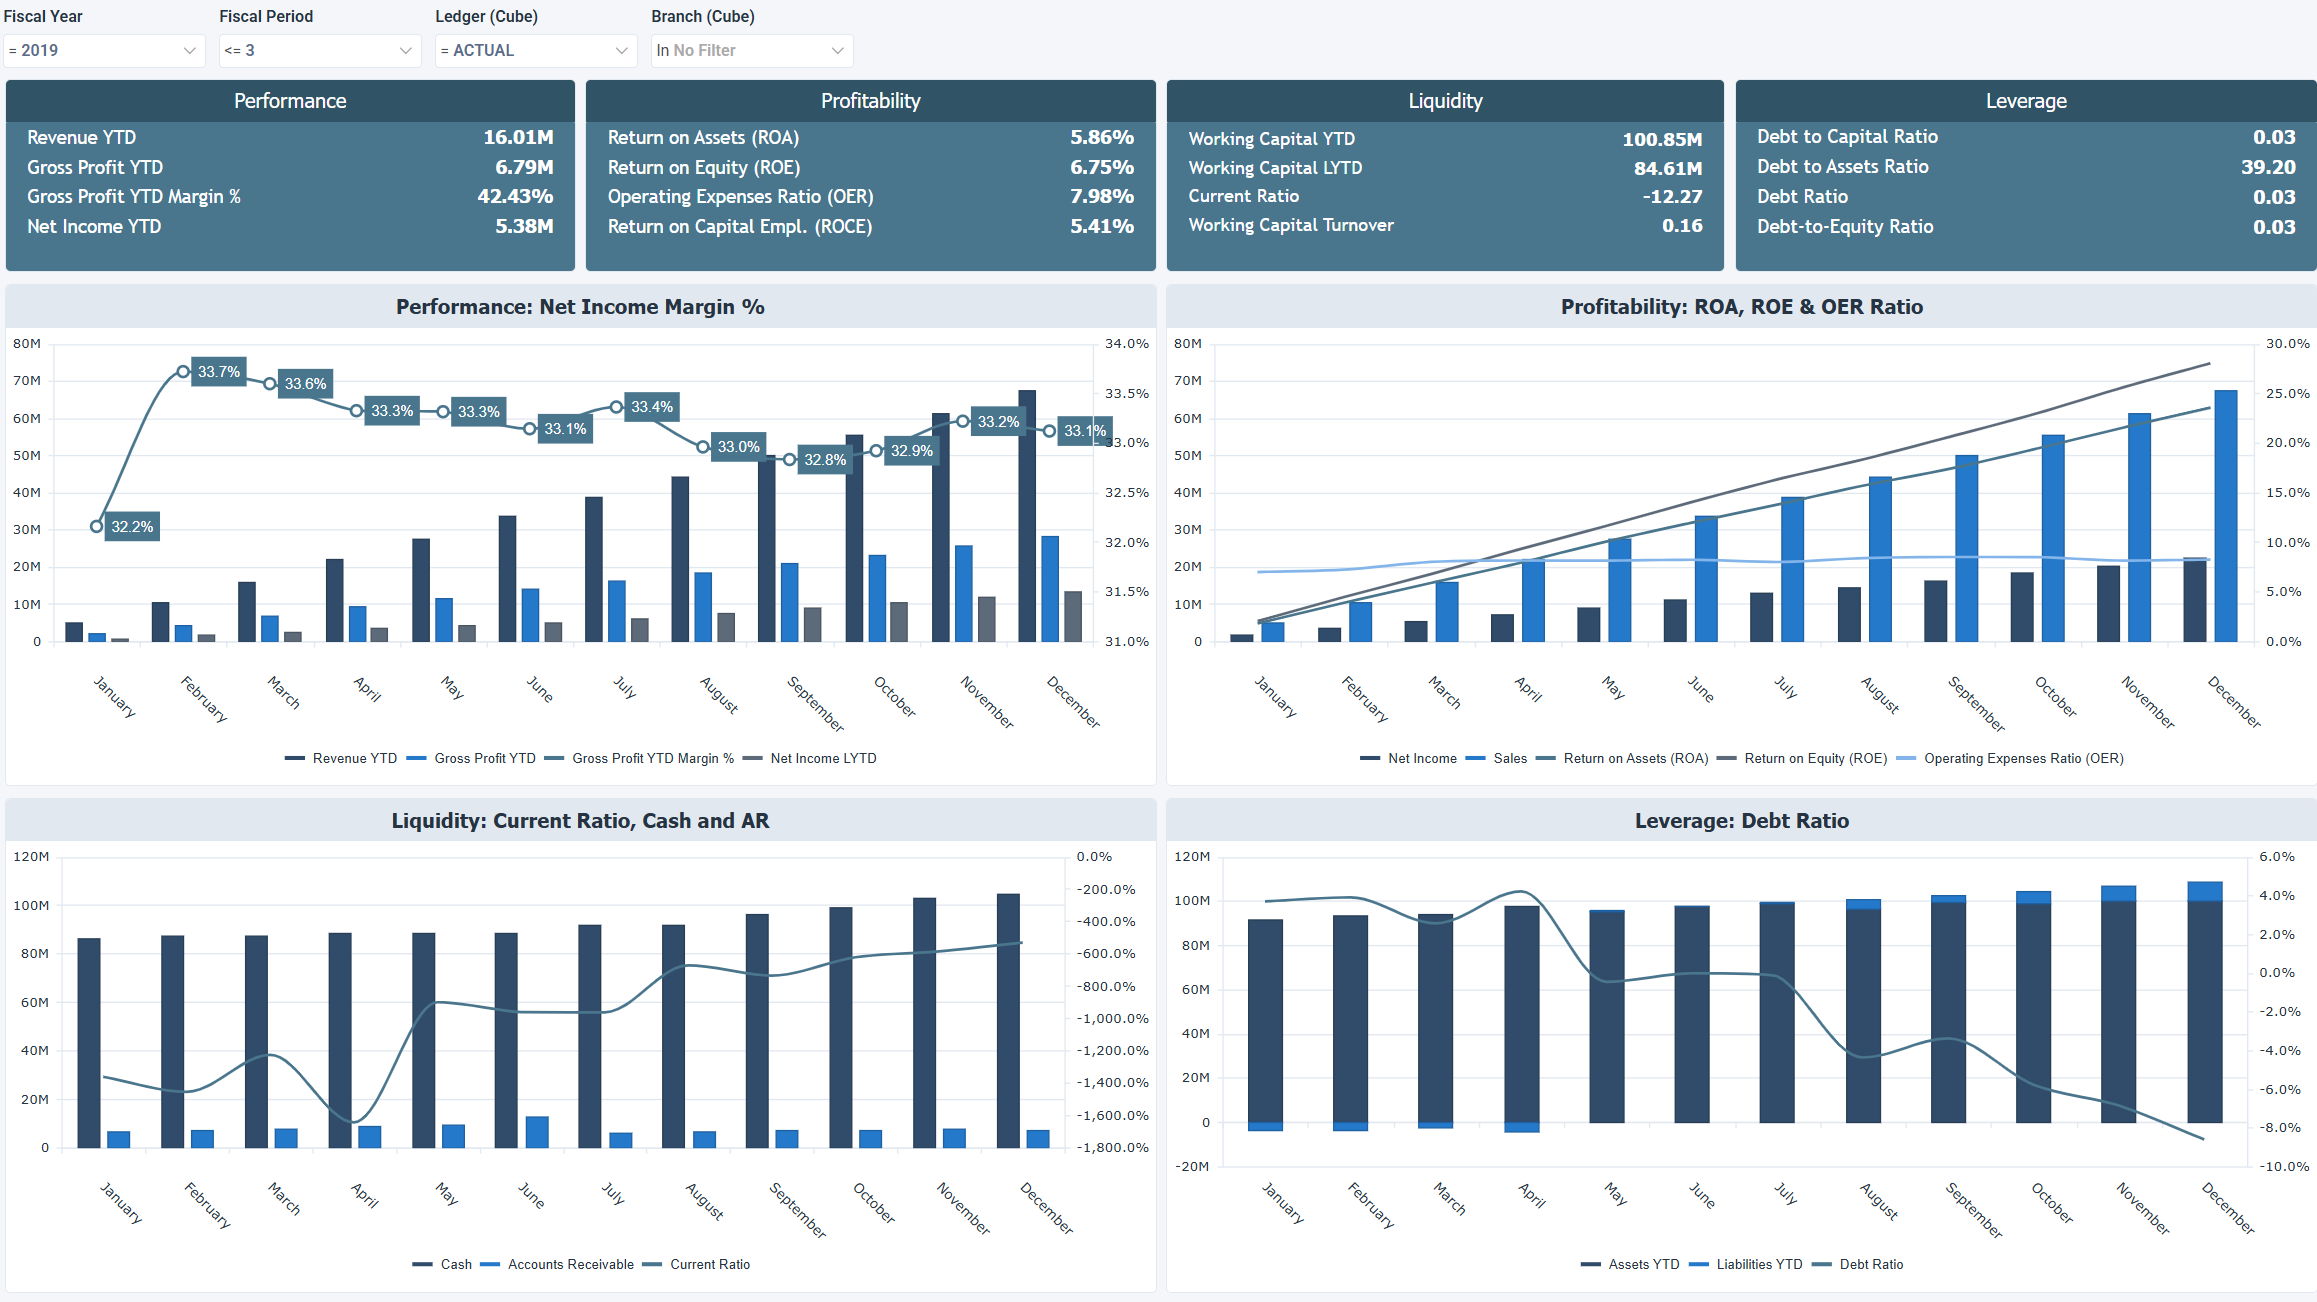
The OLAP - CFO Financial Performance Overview dashboard provides a year-to-date view of profitability, liquidity, and leverage. It helps finance leaders and executives evaluate operational performance, capital efficiency, and financial risk across core balance sheet and income statement metrics.
Benefits of this dashboard
- Gain holistic financial insight: Delivers a comprehensive view of profitability, liquidity, and leverage for executive‑level analysis.
- Enhance capital efficiency evaluation: Assesses asset and capital utilization through ROA, ROE, OER, and ROCE indicators.
- Improve liquidity oversight: Provides visibility into working capital, current ratio, and cash‑related metrics to manage short‑term obligations.
- Monitor leverage and solvency: Tracks debt ratios to help identify and mitigate financial risk.
- Benchmark year‑over‑year performance: Supports comparison of financial trends to guide strategic planning and operational improvement.
| Metric | Description |
|---|
| Revenue YTD | Total sales generated from the start of the fiscal year to the current period. Reflects cumulative growth and overall market performance. |
| Gross Profit YTD | Cumulative profit after deducting cost of goods sold from revenue year to date. Indicates profitability of core operations. |
| Gross Profit YTD Margin % | Percentage of revenue retained as gross profit year to date. A higher margin indicates stronger pricing power and cost control. |
| Net Income YTD | Total profit after all expenses and taxes from the start of the fiscal year. A positive value indicates overall financial health. |
Profitability
| Metric | Description |
|---|
| Return on Assets (ROA) | Efficiency of generating profit from total assets. A higher ROA indicates better asset utilization. |
| Return on Equity (ROE) | Profitability relative to shareholders' equity. A higher ROE indicates stronger returns for investors. |
| Operating Expenses Ratio (OER) | Proportion of operating expenses relative to revenue. A lower ratio indicates improved operating efficiency. |
| Return on Capital Employed (ROCE) | Efficiency of generating operating profit from capital employed. A higher ROCE indicates stronger capital productivity. |
Liquidity
| Metric | Description |
|---|
| Working Capital YTD | Difference between current assets and current liabilities year to date. A positive value indicates stronger short-term liquidity. |
| Working Capital LYTD | Prior-year year-to-date working capital amount used for comparison. |
| Current Ratio | Liquidity ratio calculated as current assets / current liabilities. A value above 1 indicates the ability to meet short-term obligations. |
| Working Capital Turnover | Efficiency of using working capital to generate revenue. Higher turnover indicates stronger operational performance. |
Leverage
| Metric | Description |
|---|
| Debt to Capital Ratio | Share of the capital structure funded by debt. Higher values indicate increased leverage. |
| Debt to Assets Ratio | Proportion of company assets financed through debt. A higher ratio indicates higher financial risk. |
| Debt Ratio | Ratio of total liabilities to total assets. Indicates overall financial leverage. |
| Debt-to-Equity Ratio | Comparison of total debt to shareholders' equity. Higher values indicate greater reliance on external financing. |
Example dashboard
Filters
Use the filtering panel at the top of the dashboard to control which data is shown. The filters apply to all views and ensure the dashboard reflects the selections you choose.
- Fiscal Year
- Period
- Ledger
- Branch