Sales Anomalies and Trends
The Sales Anomalies and Trends dashboard provides analytical visibility into margin erosion risk, unusual daily sales activity, and time-based sales patterns. It helps executive and operational leaders detect early warning signals in customer and product performance, understand volatility-driven risk, and investigate statistically abnormal revenue events.
Benefits of this dashboard
- Identify margin risks early: Enables proactive detection of customer‑ and product‑level margin erosion before financial impact compounds.
- Strengthen anomaly detection and revenue governance: Flags statistically abnormal sales spikes or drops to support fraud detection, operational issue diagnosis, and exceptional‑event validation.
- Analyze temporal demand patterns: Reveals day‑level and month‑level sales density trends to optimize operational planning and commercial execution.
- Protect customer and product profitability: Isolates erosion drivers to guide targeted pricing actions, contract renegotiations, and product‑portfolio decisions.
- Monitor data integrity and operational exceptions: Surfaces outliers that may indicate posting errors, timing issues, or extraordinary transactions, reinforcing trust in commercial data.
Key metrics
- Net sales variance: Percentage change in net sales relative to the comparison baseline shown in the dashboard. Higher positive values indicate faster growth, while negative values indicate contraction or instability.
- Margin erosion: Percentage decline in margin relative to expected or historical levels by customer or product. Higher values indicate worsening profitability, while lower values indicate improved margin control.
- Net sales TY: Daily net sales values for the current year used for anomaly detection. Large deviations from the expected pattern may indicate abnormal events.
- Net sales volatility (high): Upper statistical threshold for expected sales variation. Values above this level indicate unusually high daily sales that may require investigation.
- Net sales volatility (low): Lower statistical threshold for expected sales variation. Values below this level indicate unusually low daily sales that may require investigation.
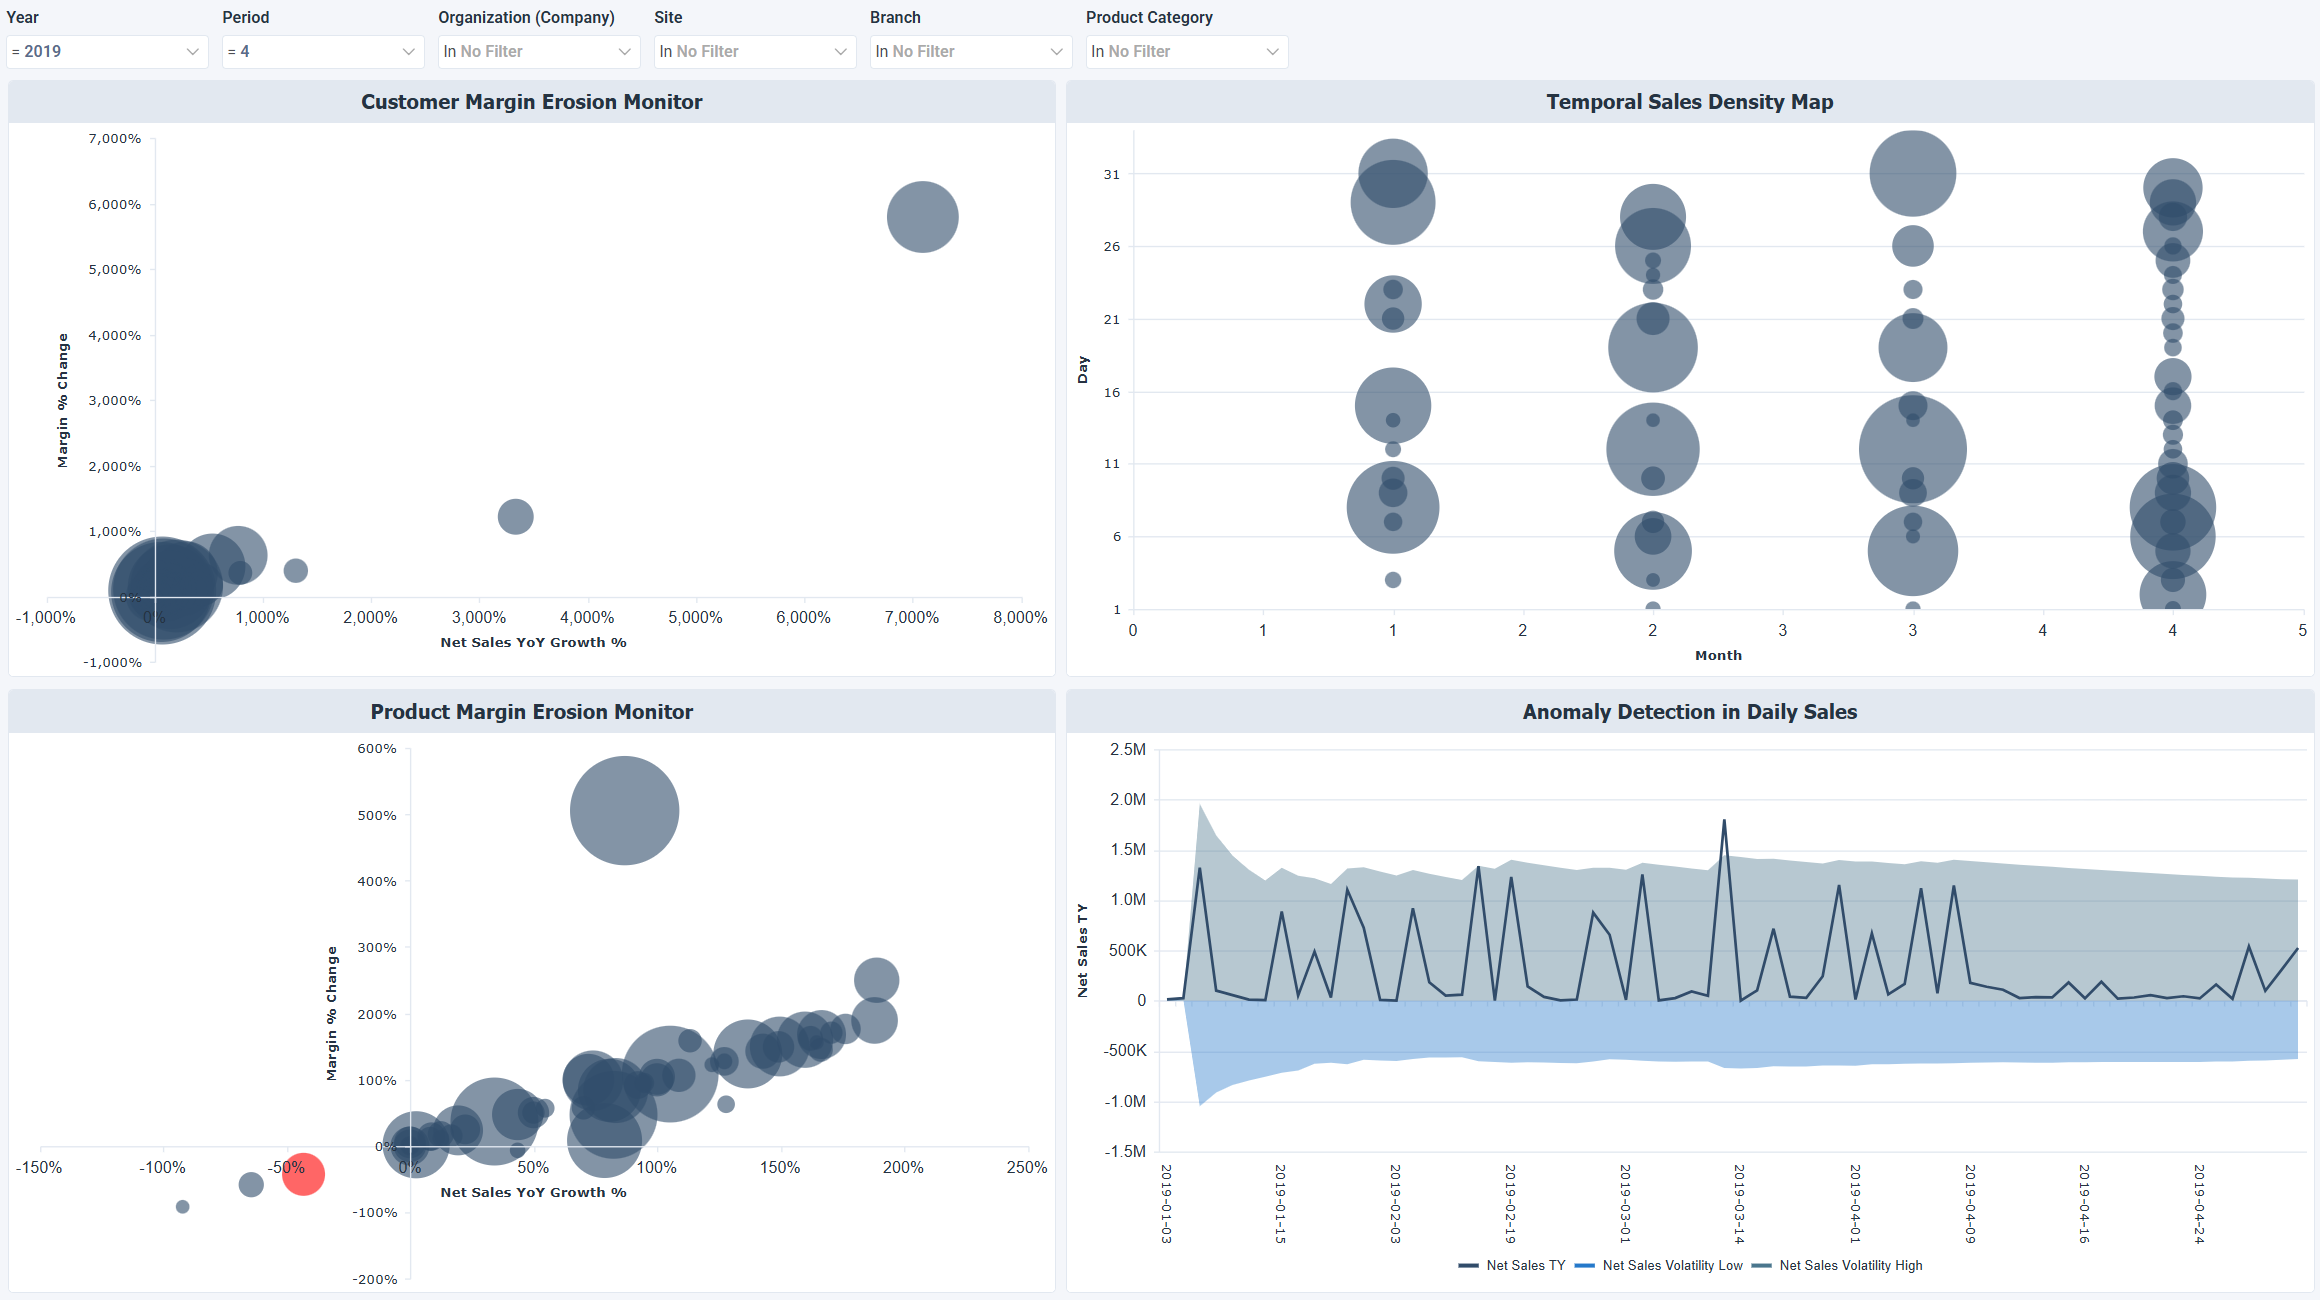
Example dashboard
Filters
Use the filtering panel at the top of the dashboard to control which data is shown. The filters apply to all views and ensure the dashboard reflects the selections you choose.
- Year
- Period
- Organization (Company)
- Site
- Branch
- Product Category