Frequency, Top Performers, and Trends
The Frequency, Top Performers, and Trends dashboard provides a detailed view of sales activity frequency, commercial concentration, and transaction efficiency across sales representatives, customers, products, and invoices. It helps executive and operational leaders evaluate revenue productivity, customer engagement intensity, invoice-level performance, and ordering behavior trends.
Benefits of this dashboard
- Assess revenue productivity: Evaluates how effectively customers and invoices convert into net sales.
- Identify top performers: Highlights the most active sales reps, customers, and products by order frequency to guide incentive planning and account prioritization.
- Monitor transaction efficiency: Provides visibility into average invoice value and revenue per customer to strengthen pricing, bundling, and sales‑strategy decisions.
- Manage commercial concentration risk: Identifies dependency on high‑frequency customers, products, or representatives to support diversification and risk‑mitigation strategies.
- Analyze sales‑activity intensity: Monitors how frequently sales transactions occur across representatives, customers, and products.
Key performance indicators
| KPI | Description |
|---|---|
| Net Sales Current Year | Total recognized sales revenue for the selected fiscal period in the current year. Higher values indicate stronger commercial performance, while lower values indicate reduced sales activity. |
| Net Sales Last Year | Total recognized sales revenue for the equivalent fiscal period in the prior year. Provides a baseline for year-over-year comparison. |
| Customers Current Year | Number of distinct customers generating sales in the selected fiscal period. Higher values indicate broader coverage, while lower values indicate greater concentration or contraction. |
| Net Sales Per Customer | Average revenue per active customer in the current year. Higher values indicate stronger customer monetization, while lower values indicate lower revenue contribution per customer. |
| Invoices Current Year | Number of sales invoices issued in the current fiscal period. Higher values indicate increased transaction volume, while lower values indicate reduced throughput. |
| Net Sales Per Invoice | Average revenue per invoice issued in the current year. Higher values indicate larger average deal sizes, while lower values indicate smaller transactions or more low-value orders. |
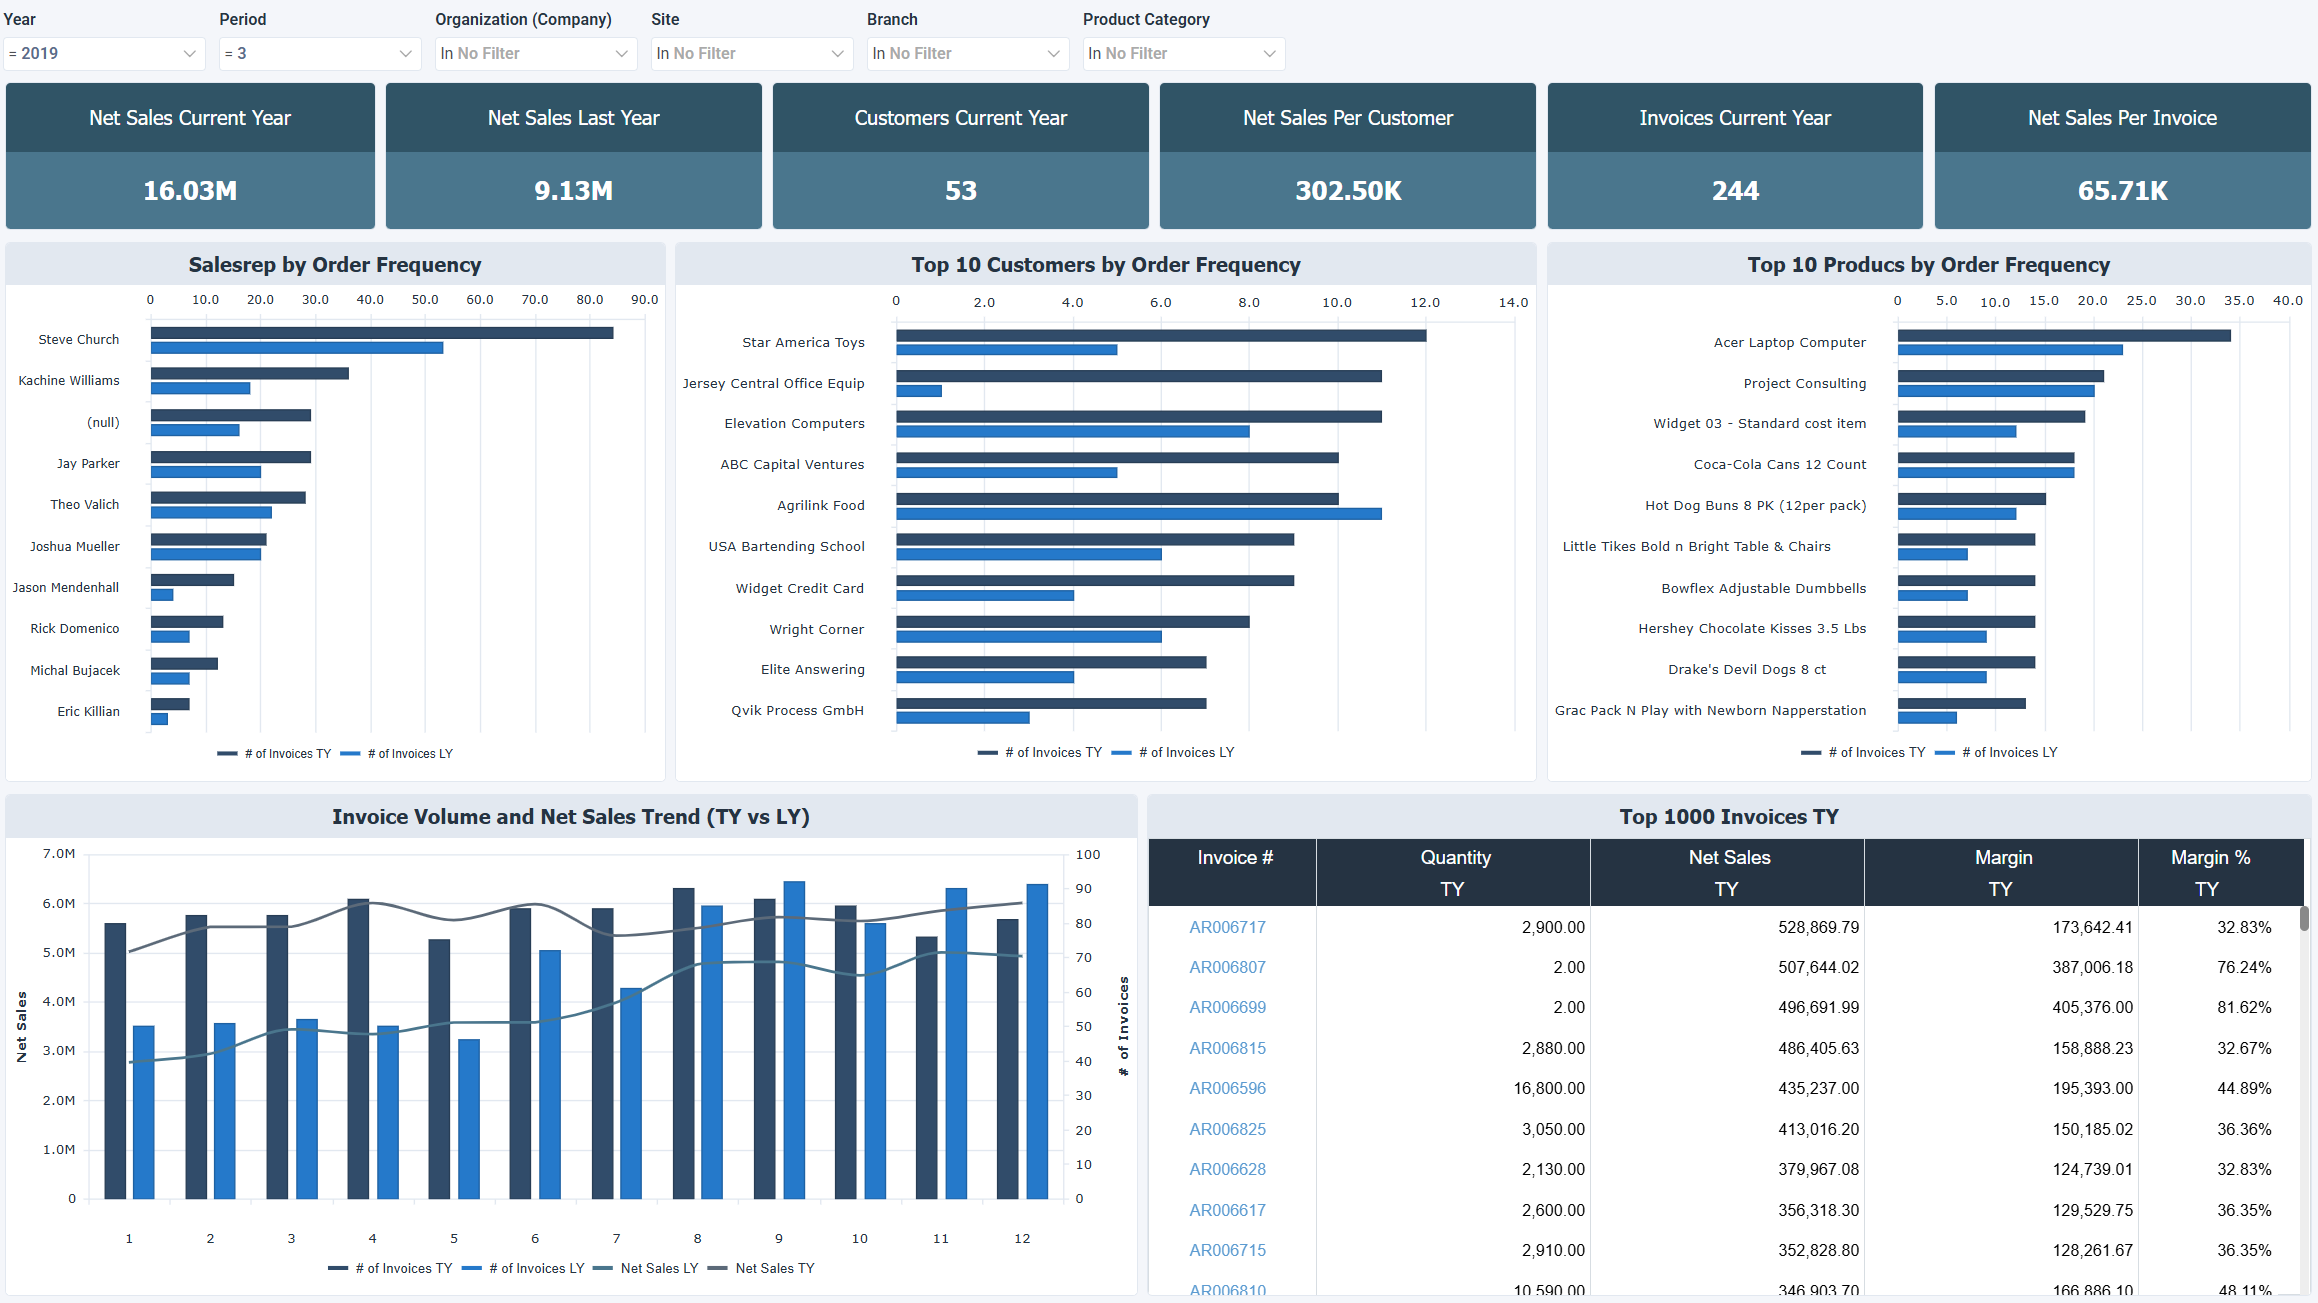
Example dashboard
Filters
Use the filtering panel at the top of the dashboard to control which data is shown. The filters apply to all views and ensure the dashboard reflects the selections you choose.
- Year
- Period
- Organization (Company)
- Site
- Branch
- Product Category