Product Sales & Geographic Performance
The Product Sales & Geographic Performance dashboard provides a consolidated view of sales performance by product, category, country, and region. It helps executive and commercial leaders evaluate product portfolio performance, geographic penetration, revenue concentration, and average revenue distribution across products and countries.
Benefits of this dashboard
- Govern product portfolio performance: Enables leadership to identify top‑performing and underperforming products to guide assortment, pricing, and lifecycle decisions.
- Analyze geographic market expansion: Provides visibility into country‑level revenue distribution to support international growth strategy and market prioritization.
- Monitor revenue concentration risk: Highlights dependency on specific products, categories, or regions to strengthen diversification and risk‑management efforts.
- Optimize commercial resource allocation: Aligns sales and marketing investments with the most productive products and geographies.
- Oversee market coverage at an executive level: Evaluates how effectively the organization converts geographic footprint into revenue performance.pl
Key performance indicators
| KPI | Description |
|---|---|
| Net Sales Current Year | Total recognized sales revenue for the selected fiscal period in the current year. Higher values indicate stronger commercial execution and demand, while lower values indicate revenue contraction or weaker product performance. |
| Net Sales Last Year | Total recognized sales revenue for the equivalent fiscal period in the prior year. Provides a baseline for year-over-year comparison by product and geography. |
| Products Current Year | Number of distinct products generating sales in the current fiscal period. Higher values indicate broader product activity, while lower values indicate concentration or reduced assortment usage. |
| Net Sales / Product Current Year | Average revenue generated per active product. Higher values indicate stronger product monetization and portfolio efficiency, while lower values indicate lower revenue contribution per product. |
| Countries Current Year | Number of distinct countries generating sales in the current fiscal period. Higher values indicate broader international presence, while lower values indicate geographic concentration. |
| Net Sales / Country | Average revenue generated per active country. Higher values indicate stronger country performance and deeper penetration, while lower values indicate lower revenue density by geography. |
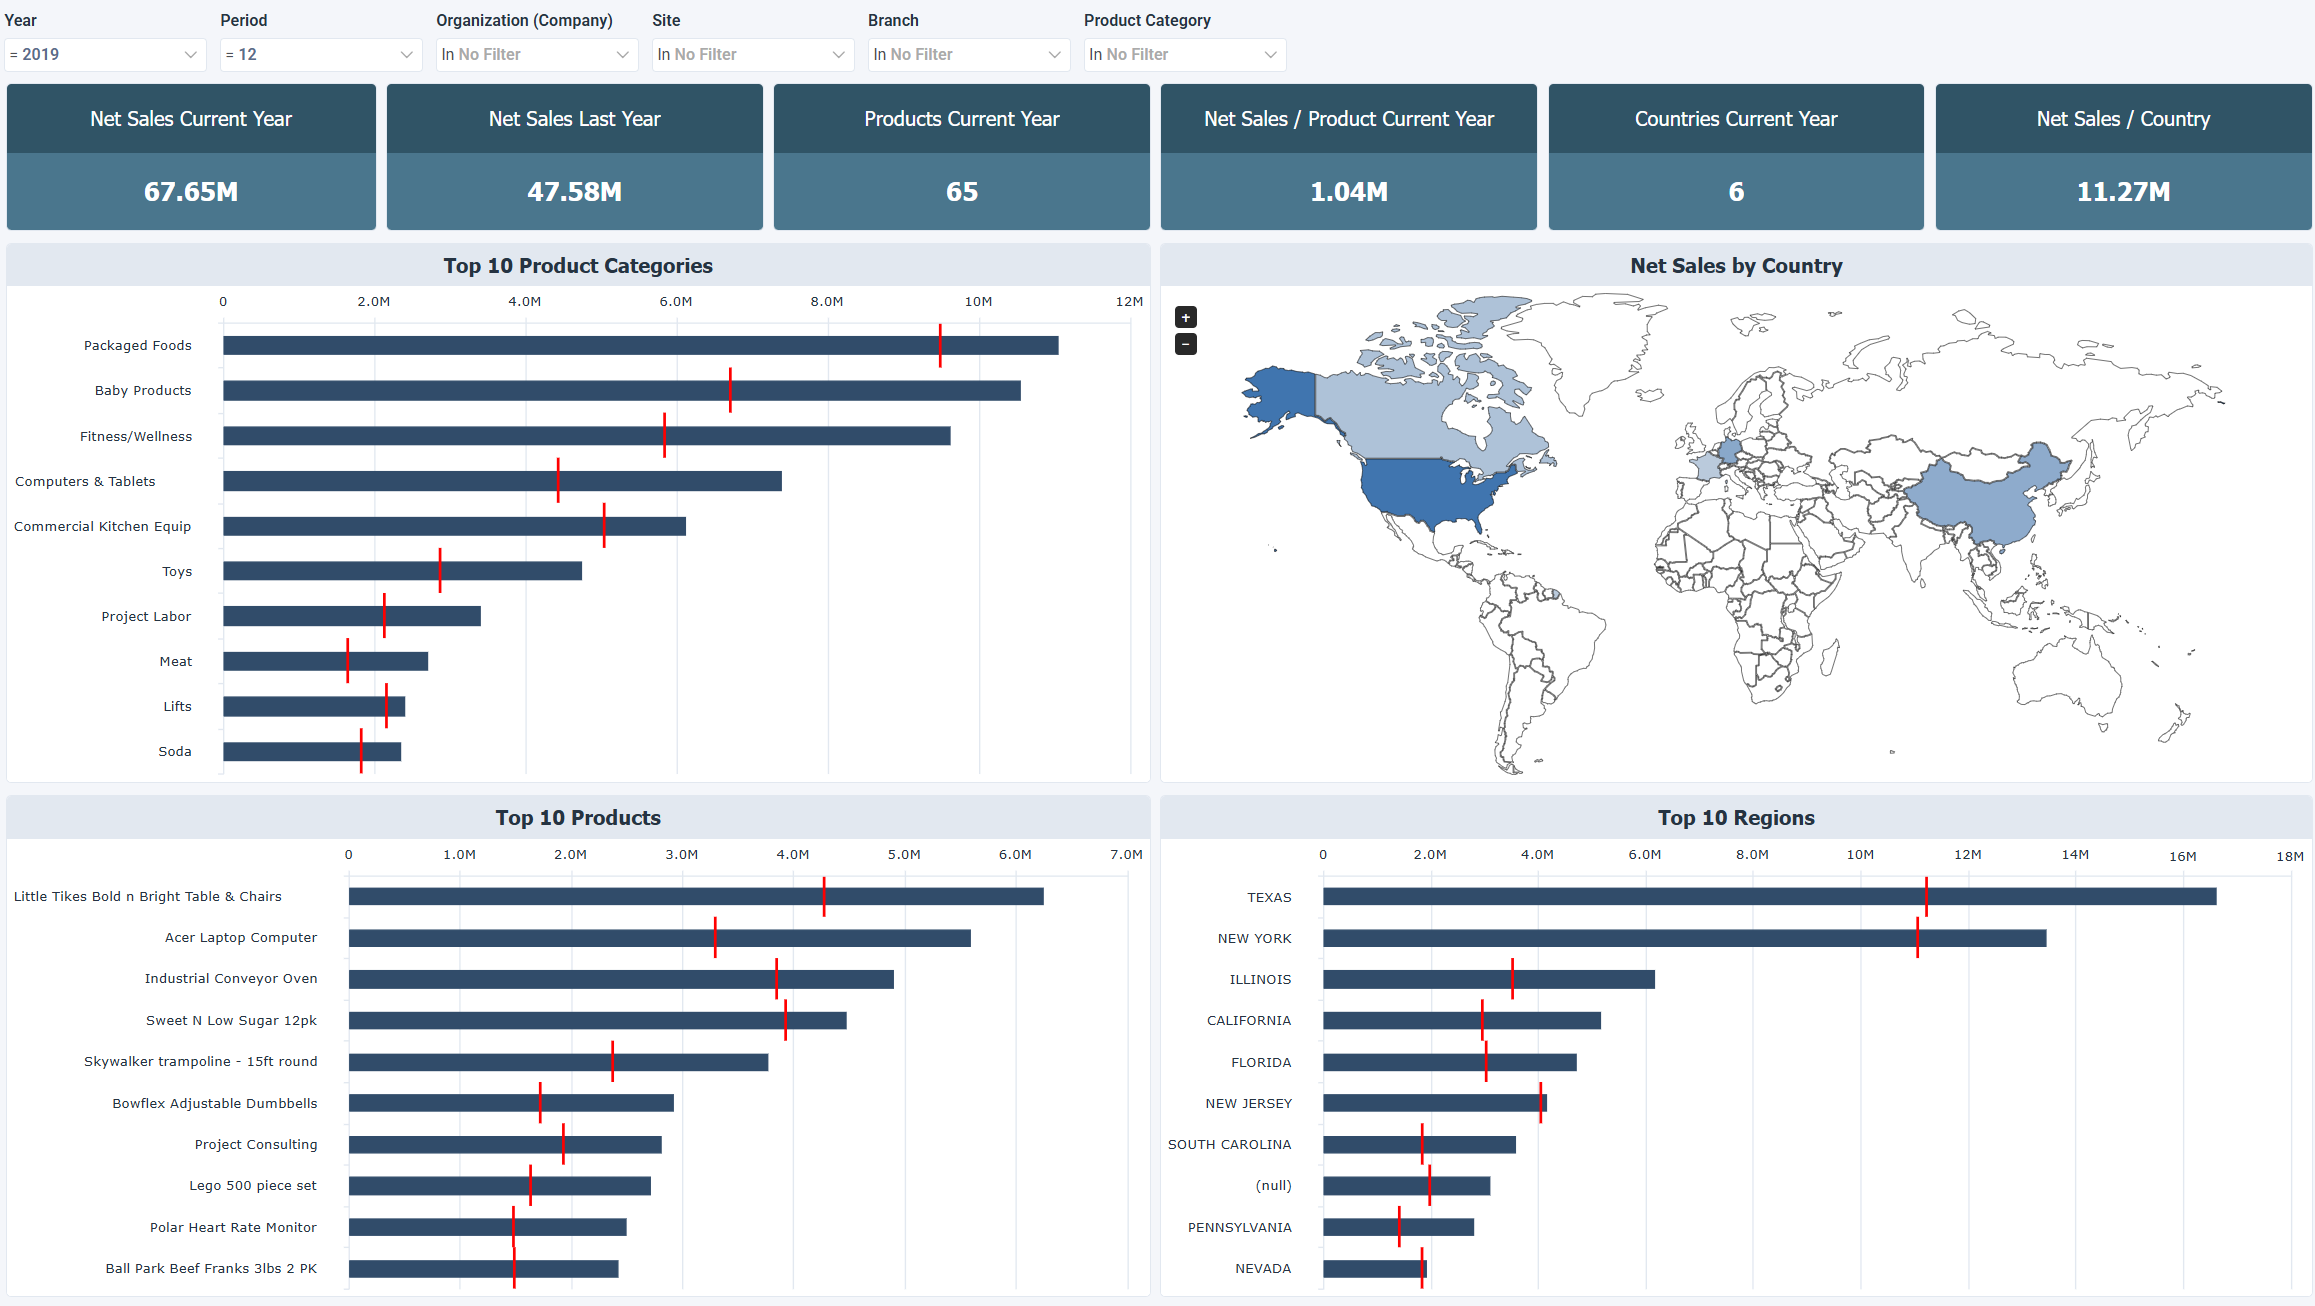
Example dashboard
Filters
Use the filtering panel at the top of the dashboard to control which data is shown. The filters apply to all views and ensure the dashboard reflects the selections you choose.
- Year
- Period
- Organization (Company)
- Site
- Branch
- Product Category