Strategic Financial Health & Efficiency
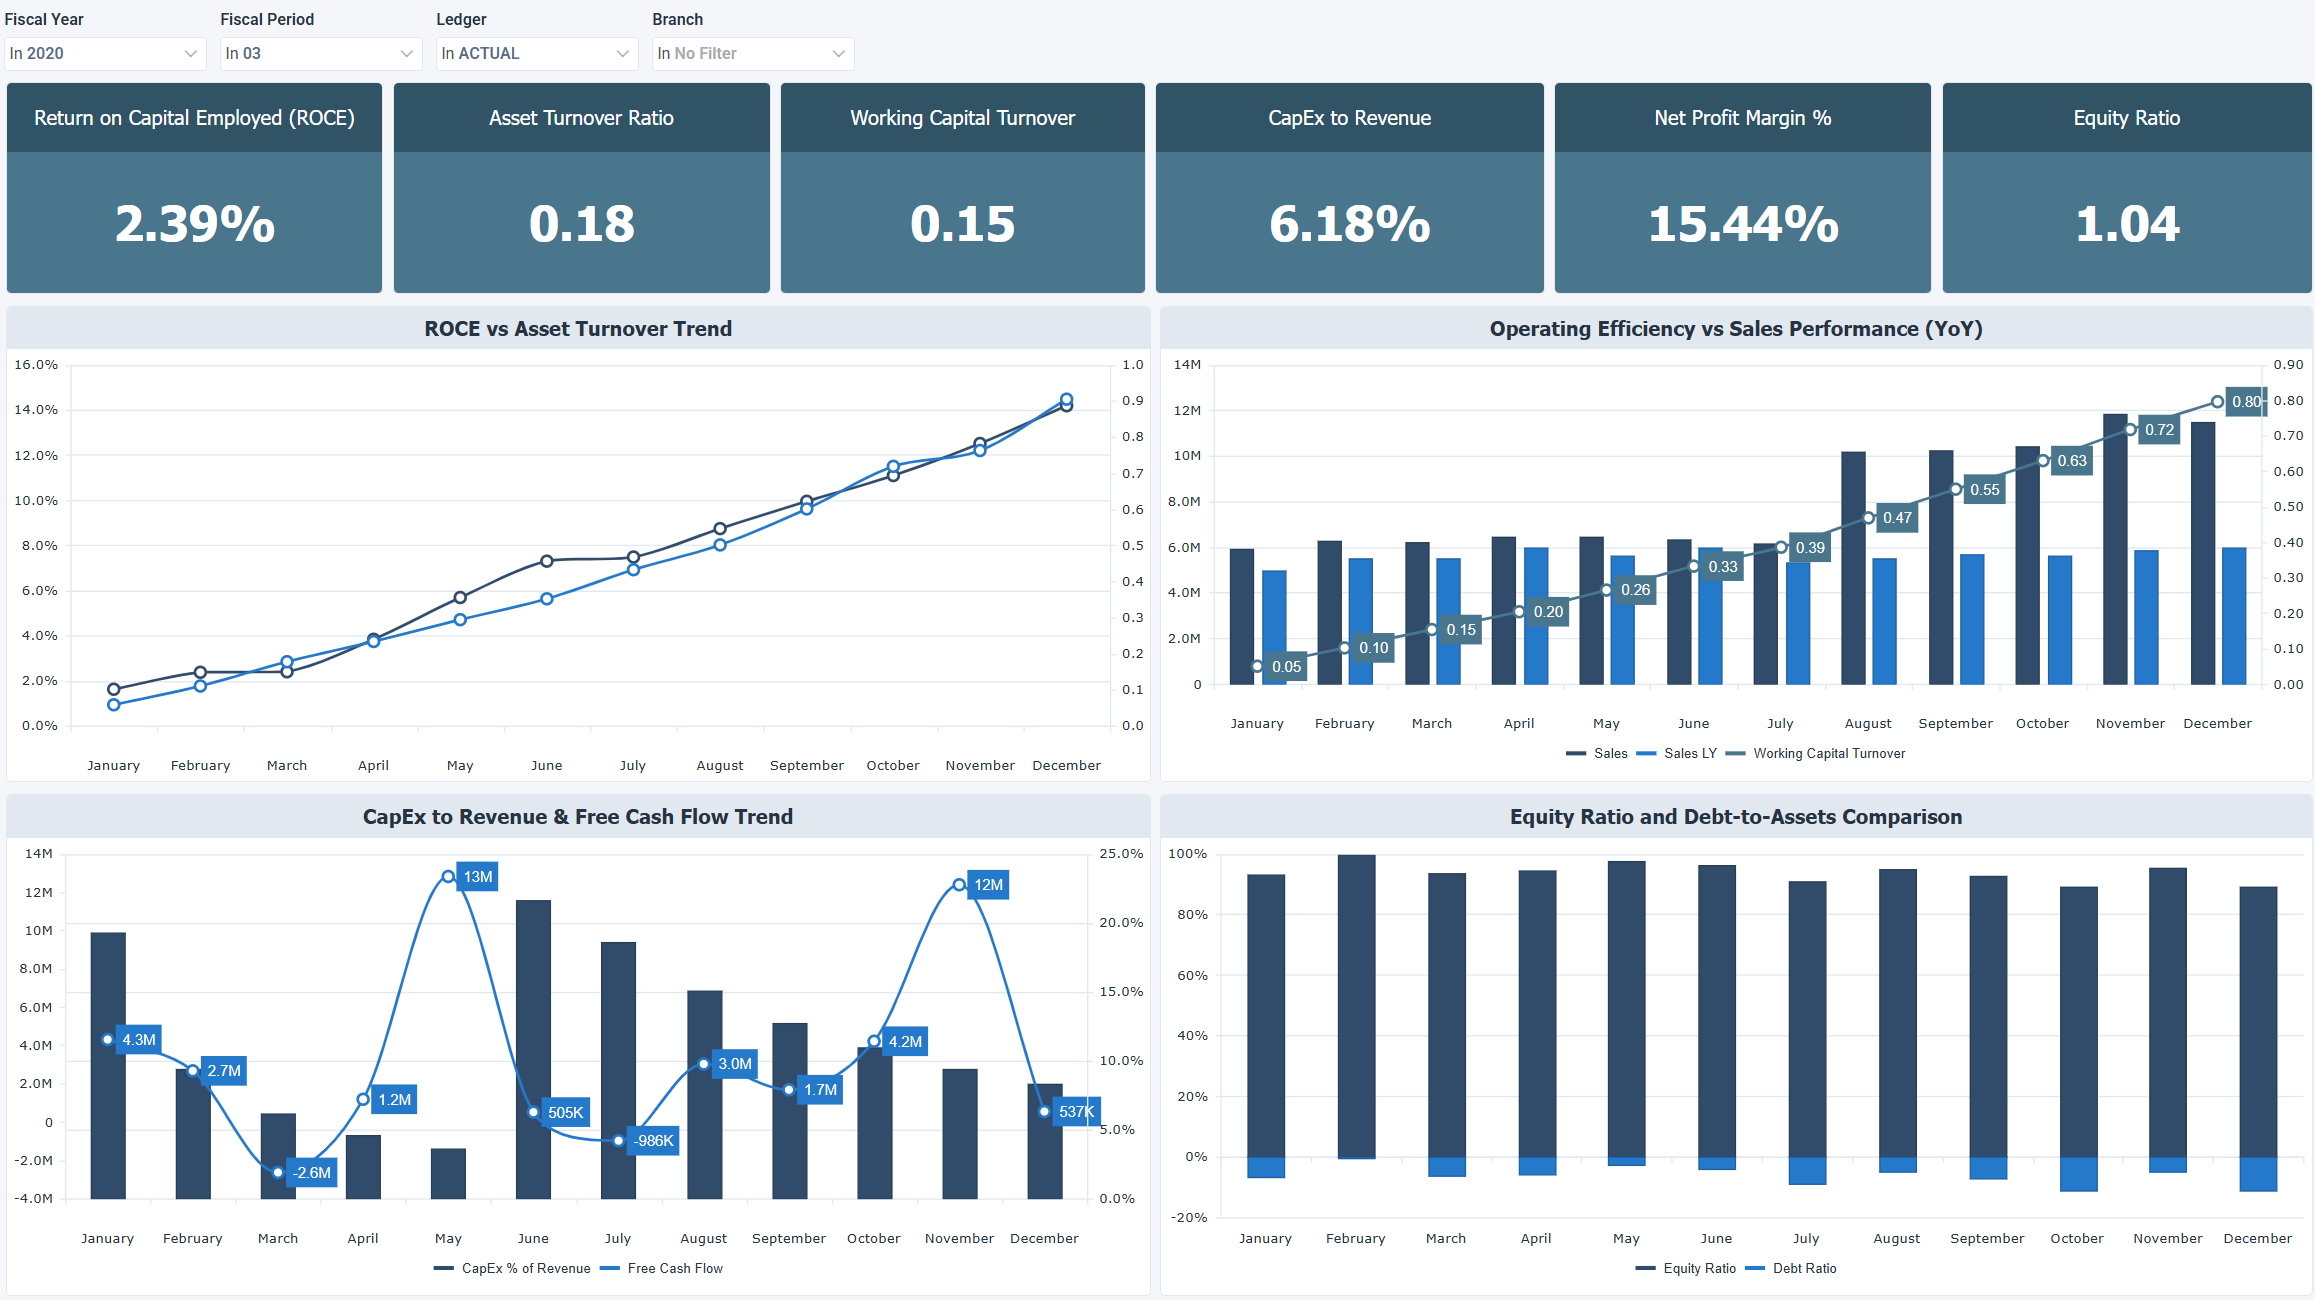
The Strategic Financial Health & Efficiency dashboard provides an executive view of capital efficiency, profitability, asset utilization, and balance sheet structure. It helps senior leaders assess how effectively the organization converts invested capital into profits, how efficiently it uses assets and working capital to generate sales, and how sustainable its financial structure is over time.
Benefits of this dashboard
- Evaluate capital efficiency: Helps executives assess whether invested capital is generating adequate operating returns.
- Monitor operational asset productivity: Measures how effectively assets and working capital drive revenue growth.
- Analyze profitability sustainability: Provides visibility into net‑margin strength to guide pricing, cost structure, and strategic investment decisions.
- Oversee capital intensity and reinvestment: Supports leadership in balancing growth investments with revenue‑generation capacity.
- Assess financial structure and solvency: Strengthens governance by tracking the balance between equity financing and leverage exposure.
Key performance indicators
| KPI | Description |
|---|---|
| Return on Capital Employed | Operating return generated from total capital employed. Higher values indicate stronger capital productivity, while lower values indicate underutilized capital or weaker operating returns. |
| Asset Turnover Ratio | Revenue generated per dollar of total assets. Higher values indicate stronger asset utilization, while lower values indicate a larger asset base relative to revenue. |
| Working Capital Turnover | Sales generated per dollar of working capital. Higher values indicate more efficient use of liquidity, while lower values indicate more capital tied up in short-term assets. |
| CapEx to Revenue | Capital expenditures as a percentage of revenue. Higher values indicate greater reinvestment intensity, while lower values indicate lighter capital intensity or reduced reinvestment. |
| Net Profit Margin % | Net income as a percentage of revenue. Higher values indicate stronger profitability, while lower values indicate margin compression and weaker earnings conversion. |
| Equity Ratio | Share of total assets financed by shareholders' equity. Higher values indicate lower leverage risk, while lower values indicate greater reliance on debt financing. |
Example dashboard
Filters
Use the filtering panel at the top of the dashboard to control which data is shown. The filters apply to all views and ensure the dashboard reflects the selections you choose.
- Fiscal Year
- Fiscal Period
- Ledger
- Branch