Cost Structure & Expense Efficiency
The Cost Structure & Expense Efficiency dashboard provides a consolidated view of operating costs, expense efficiency, and profitability impact. It helps finance teams and executives analyze expense mix, monitor cost growth relative to revenue, understand non-operating cost impact, and track EBITDA performance to support operating and strategic decisions.
Benefits of this dashboard
- Monitor cost efficiency: Enables continuous tracking of operating‑expense behavior to identify emerging inefficiencies and potential overruns.
- Optimize profitability: Correlates expense levels with EBITDA performance to support margin protection.
- Assess growth sustainability: Helps executives evaluate whether expense growth is aligned with revenue expansion.
- Understand non‑operating cost impact: Provides transparency into how amortization and interest affect net‑income performance.
- Strengthen operational budget control: Highlights expense‑category concentration and variance trends to reinforce financial discipline.
Key performance indicators
| KPI | Description |
|---|---|
| Operating Expenses | Total costs incurred to support core business operations, including administrative, facility, and service-related costs. Higher values indicate increased cost consumption, while lower values reflect improved operational cost control. |
| Operating Expenses Ratio | Operating expenses as a proportion of revenue. Higher ratios indicate declining cost efficiency and margin pressure, while lower ratios reflect improved expense discipline and operating leverage. |
| Amortization | Systematic allocation of the cost of intangible assets over their useful lives. Higher values increase non-cash expense burden and reduce reported earnings, while lower values indicate reduced asset consumption impact. |
| Interest Expense | Cost of servicing debt obligations. Higher values indicate increased leverage or higher borrowing costs, negatively impacting net profitability and cash flow flexibility. |
| EBITDA | Earnings before interest, taxes, depreciation, and amortization as an indicator of core operating profitability and cash-generating capacity. Higher values indicate stronger operating performance and valuation strength. |
| Expense Growth Rate | Period-over-period percentage change in operating expenses. Higher growth rates may signal cost escalation or expansion activity, while lower or negative growth reflects tightening cost controls. |
Example dashboard
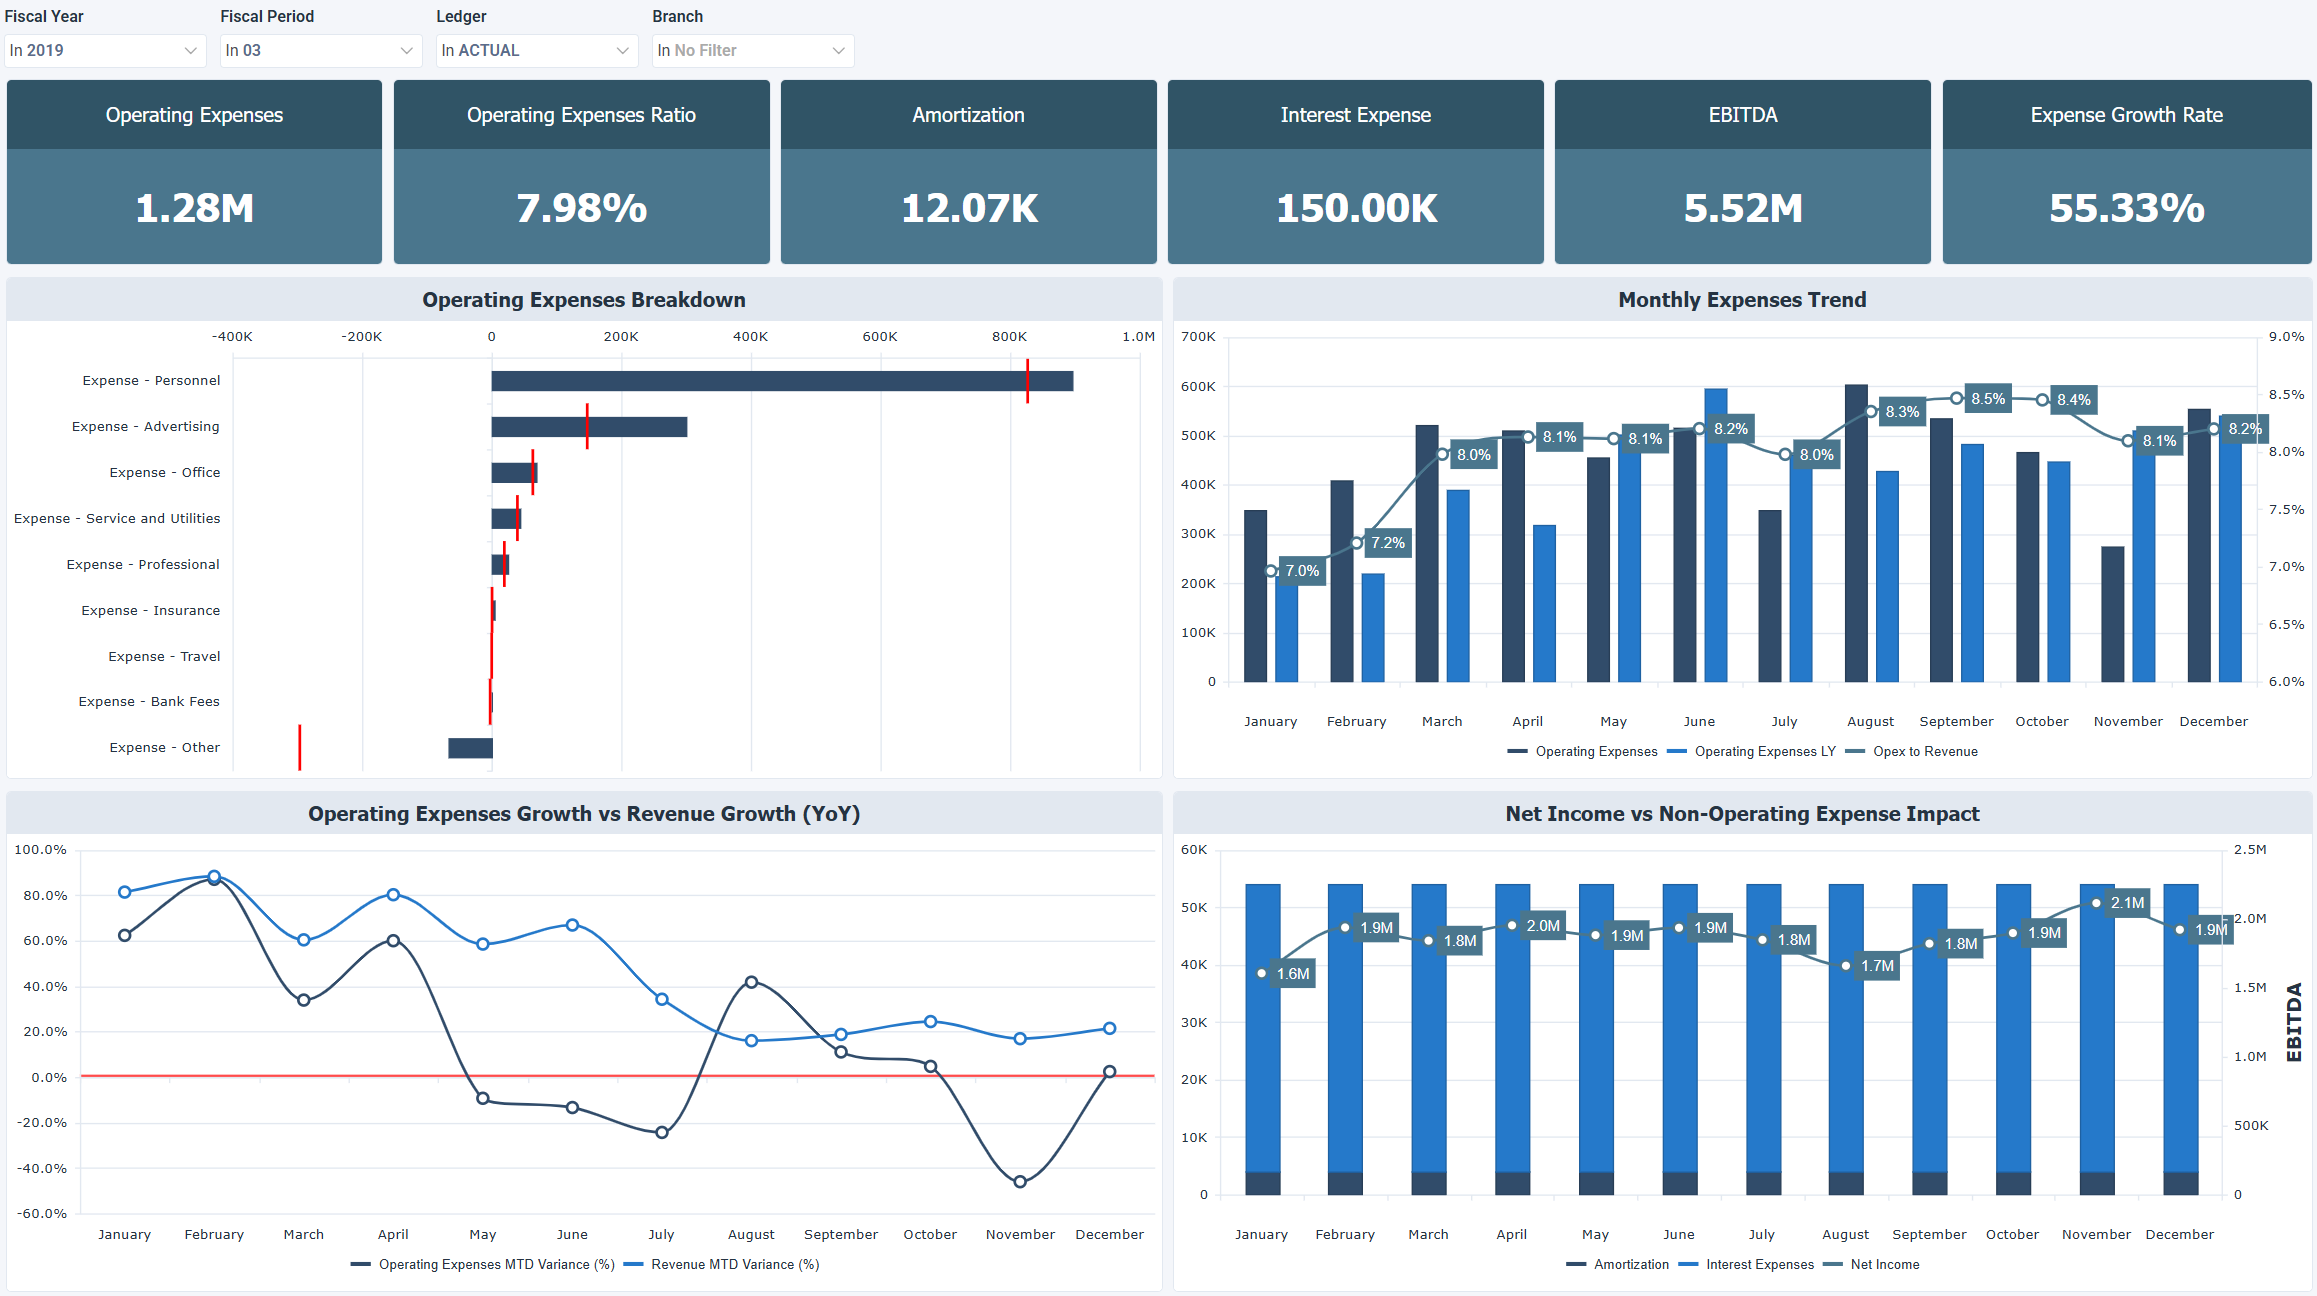
Filters
Use the filtering panel at the top of the dashboard to control which data is shown. The filters apply to all views and ensure the dashboard reflects the selections you choose.
- Fiscal Year
- Fiscal Period
- Ledger
- Branch