OLAP - Sales Anomalies and Trends
The OLAP - Sales Anomalies and Trends dashboard provides analytical visibility into margin erosion risk, unusual daily sales activity, and time-based sales patterns. It helps executive and operational leaders detect early warning signals in customer and product performance, assess volatility-driven risk, and investigate statistically abnormal revenue events.
Benefits of this dashboard
- Analyze sales activity intensity: Monitors how frequently sales transactions occur across representatives, customers, and products.
- Assess revenue productivity: Evaluates how effectively customers and invoices convert into net sales.
- Identify top performers: Highlights the most active sales reps, customers, and products by order frequency to guide incentives and account prioritization.
- Monitor transaction efficiency: Provides visibility into average invoice value and revenue per customer to strengthen pricing, bundling, and sales strategy decisions.
- Manage commercial concentration risk: Identifies dependency on high‑frequency customers, products, or representatives to support diversification and risk‑mitigation strategies.
Key metrics
- Net sales variance: Percentage change in net sales relative to the comparison baseline shown in the dashboard. Higher positive values indicate faster growth, while negative values indicate contraction or instability.
- Margin erosion: Percentage decline in margin relative to expected or historical levels by customer or product. Higher values indicate worsening profitability, while lower values indicate improved margin control.
- Net sales TY: Daily net sales values for the current year used for anomaly detection. Large deviations from the expected pattern may indicate abnormal events.
- Net sales volatility (high): Upper statistical threshold for expected sales variation. Values above this level indicate unusually high daily sales that may require investigation.
- Net sales volatility (low): Lower statistical threshold for expected sales variation. Values below this level indicate unusually low daily sales that may require investigation.
Example dashboard
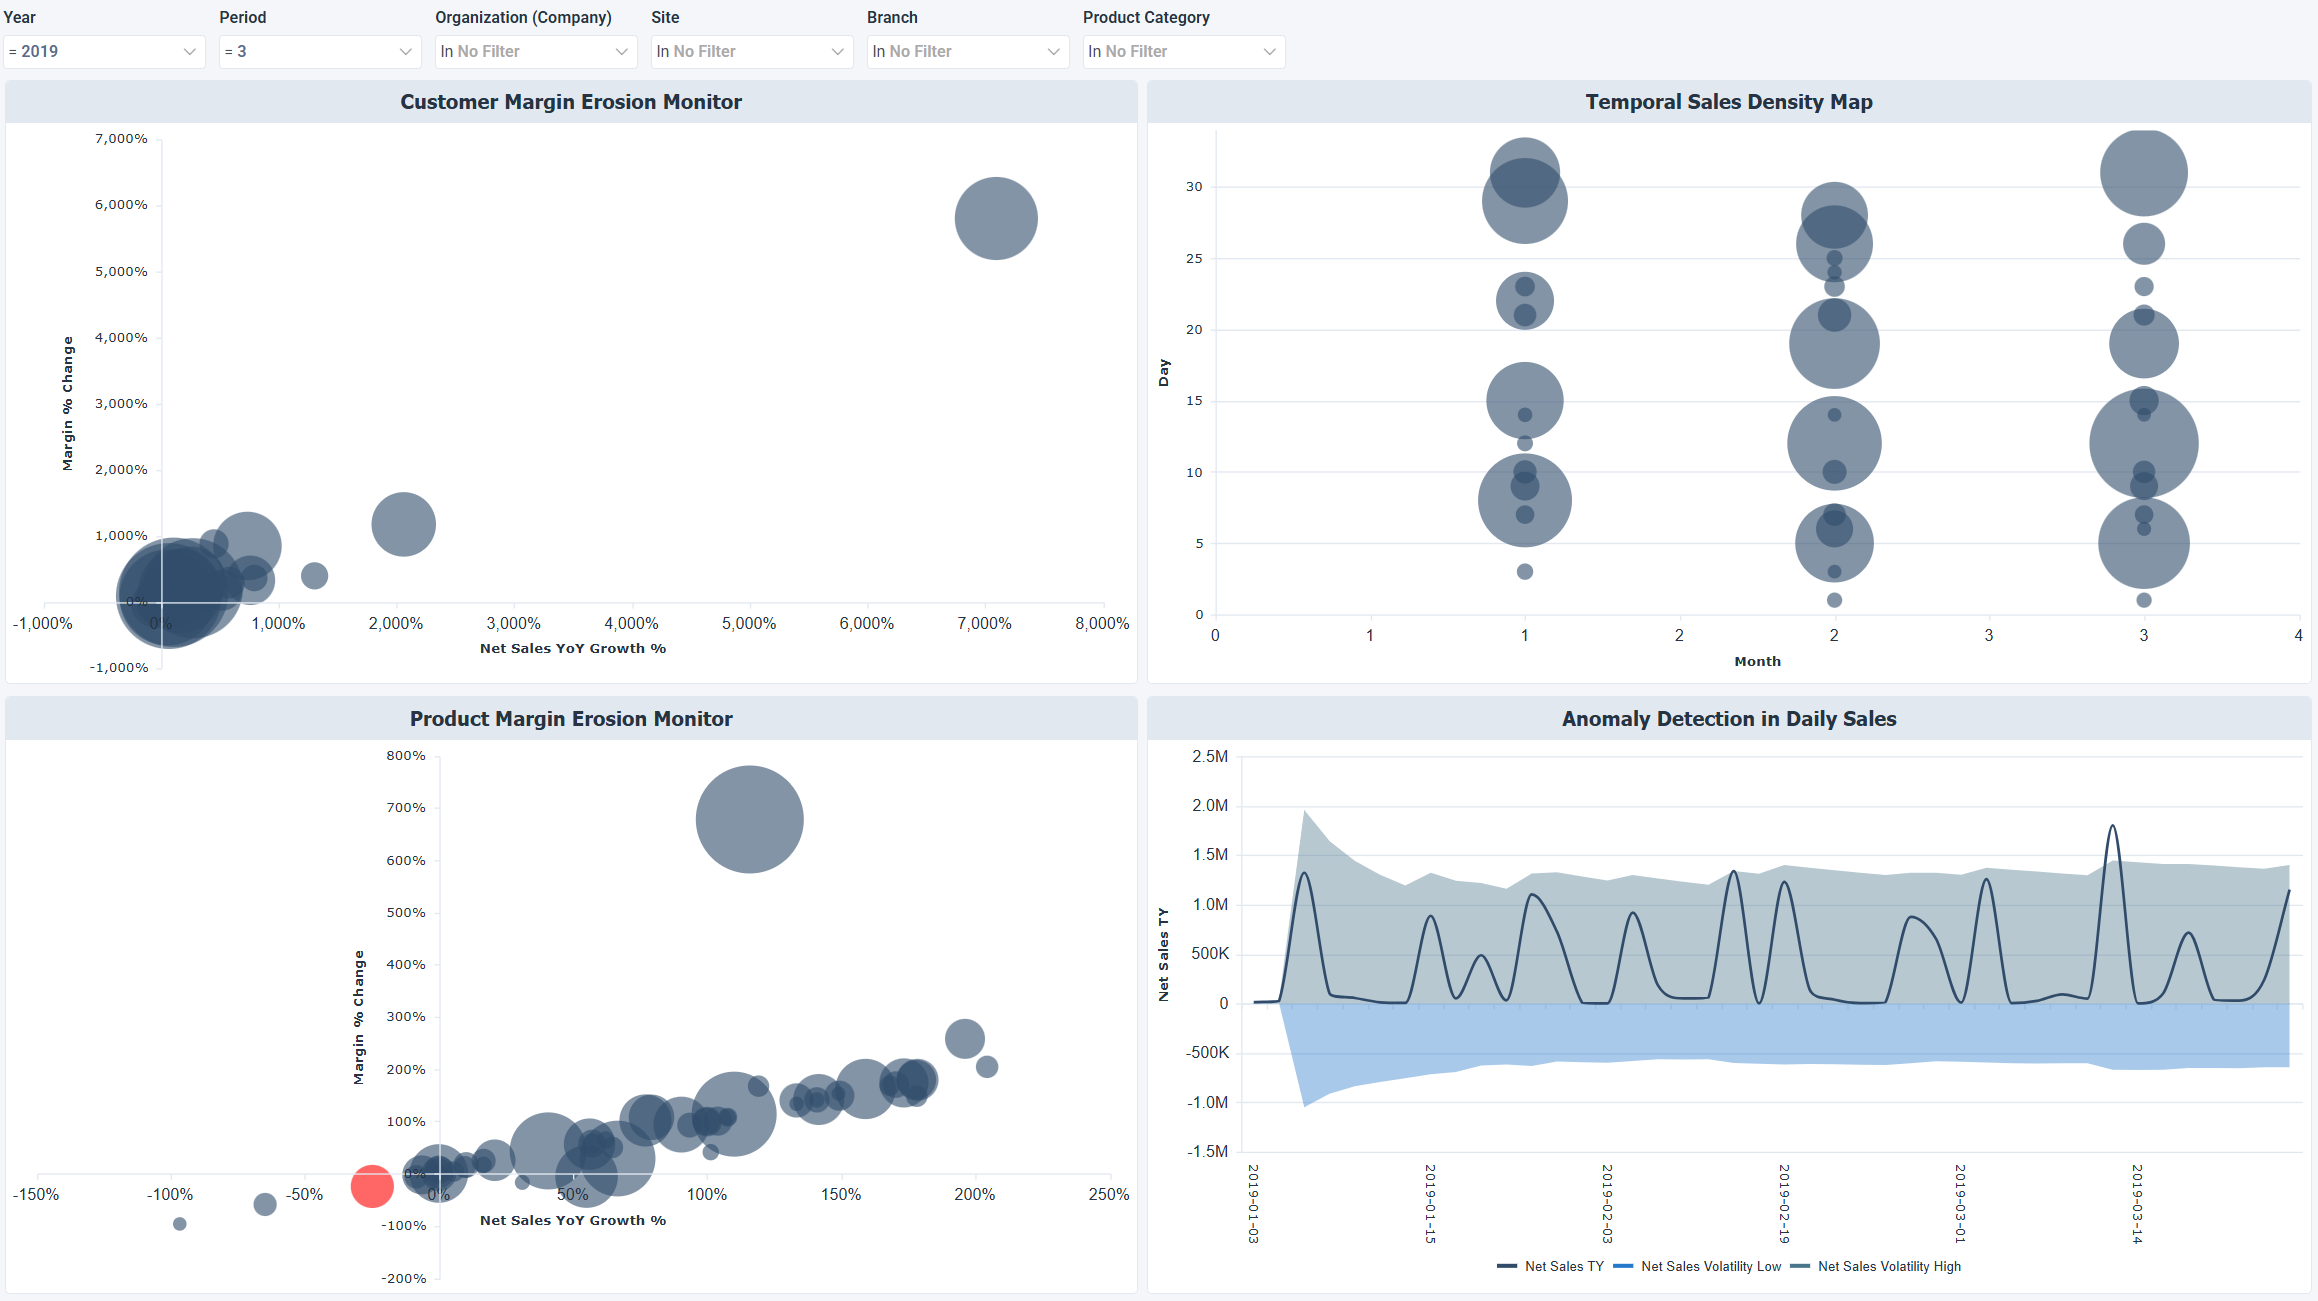
Filters
Use the filtering panel at the top of the dashboard to control which data is shown. The filters apply to all views and ensure the dashboard reflects the selections you choose.
- Year
- Period
- Organization (Company)
- Site
- Branch
- Product Category