Nectari Copilot for Workbooks
Nectari Copilot in workbooks uses the data and structure from the sheet on screen to provide insights, recommendations, and execute instructions. It can analyze formulas, summarize reports, suggest alternative layouts or calculations, and perform changes such as modifying cell contents and updating workbook settings.
What workbooks can do
Workbooks combine a spreadsheet interface with features specific to SEI, including data extraction, formulas, and reporting. Understanding what workbooks can do helps you write more precise prompts for Nectari Copilot.
- Sheets: add new tabs, duplicate existing ones, or reorganize your workbook structure.
- Layout and formatting: adjust columns, fonts, colors, and themes.
- Cell controls: use functions, set cell types, add dropdowns or slicers, and insert sparklines.
- Filters: hide zeros, clear cache, or apply filters and slicers to narrow your data.
- Data extraction and drilldown: pull raw data from a model or view details behind formulas and extractions.
- Pivot tables and formulas: create pivoted summaries and build custom calculations.
- Import Excel: bring external spreadsheets into workbooks.
Provide context
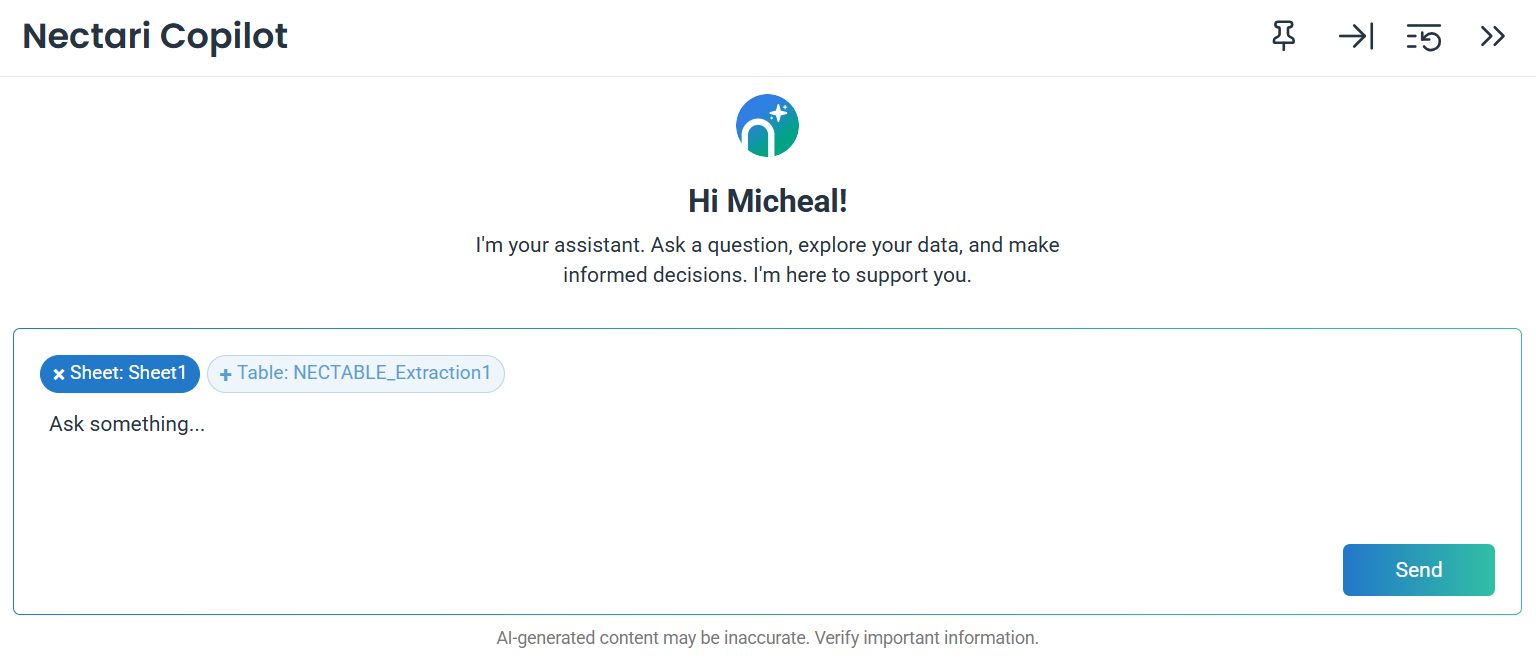
Nectari Copilot uses the active cell selection and the context tags in the chat input to determine what to analyze. By default, the current sheet is included as context. You can also add a data extraction table by selecting it from the chat input.
If you select more than 200,000 cells, Nectari Copilot may not be able to process the request.
Prompt ideas
Insights
Insights are explanations or analyses of what is in your workbook data. These can describe the meaning of a formula, summarize a report, or interpret selected cells.
- Give me a summary of this sheet.Copy
- What does the formula in the current cell calculate?Copy
- Explain the formula in the cell F7.Copy
- What does the Debit column formula do?Copy
Recommendations
Recommendations suggest alternative ways to structure your workbook or improve formulas.
- Is there a better way to write the formula in the current cell?Copy
- How can I improve the layout of this sheet?Copy
- Suggest a better structure for this report.Copy
- What would make this sheet easier to read?Copy
Instructions
Instructions are direct commands that update your workbook without manually editing it. Use these to change cell values or formulas, apply translations, adjust layouts, and add new data or summaries.
- Insert a calculation using cell references in column F that sums the Debit and Credit.Copy
- Create a VLOOKUP in G7 to find the account code from B7 in Sheet3 and return the description from column 2.Copy
- Concatenate in column H (starting from row 7) the values from columns B and C, adding a space between them.Copy
- Translate the selected cells into Spanish.Copy
- Update the selected cells with a total amount of 5000, divided equally.Copy
- Add a subtotal for each column.Copy
- Generate a list of year and month from 2024 to 2026 below the selected cell.Copy
NECCOPILOT formula
The NECCOPILOT() formula embeds a Nectari Copilot question directly in a cell. The answer appears in the cell and refreshes automatically whenever the prompt or the referenced data changes. It works well for displaying KPIs directly in the sheet or for questions that need to update automatically when filters or slicers change.
- Display KPIs in the sheet, such as the top sales rep or the highest revenue product. The answer updates when the data changes.
- Works with filters and slicers so the answer reflects the current selection automatically without re-running the prompt.
Syntax
The formula accepts alternating prompt and context arguments. Chain as many prompt and context pairs as needed to give Nectari Copilot multiple sources of information for one question.
=NECCOPILOT(prompt_part1, [context1], [prompt_part2], [context2], ...)
Spill mode
Adding "spill" as a context argument outputs the answer across multiple cells in a single column instead of returning everything in one cell. This is useful when the answer is a list.
=NECCOPILOT("List me all sales reps in Canada", "spill")
Example prompts
=NECCOPILOT("Based on the following data, who is the top sales rep overall and why", NECTABLE_Extraction2[#All])
Nectari Copilot answer: The top sales rep is [name], because they have the highest total sales amount across the provided records, driven by several large FIN003, FIN008, FIN301, and FIN304 transactions.
=NECCOPILOT("Based on the following data, who is the top sales rep in each year", NECTABLE_Extraction2[#All])
Nectari Copilot answer: 2017: [name], 2018: [name], 2019: [name].
Other typical questions for this formula:
- Which product had the lowest sales this year?Copy
- Which product should we stop selling in the upcoming year and why?Copy
- Who were the top 3 sales reps in 2022?Copy
- How did sales compare between Q1 and Q2?Copy
- Which region generated the most revenue this year?Copy
NECCOPILOT_SUMMARIZE formula
The NECCOPILOT_SUMMARIZE() formula generates a written summary of the selected content in your workbook. The summary refreshes automatically when the data changes, so it stays current without manual updates. You can place summaries on multiple sheets and combine them into a reporting pack.
- Generate a written narrative in the sheet instead of writing it manually or copying results from the chat.
- Combine with a reporting pack to add automatically generated text alongside numbers and visualizations across multiple sheets.
- Control the output by setting a word count limit and choosing the language directly in the formula.
Syntax
=NECCOPILOT_SUMMARIZE(range, [maximum words], [language])
You can use a table name instead of a fixed range to keep the summary dynamic as data changes.
When you distribute a workbook that contains Copilot summaries, a new summary is generated for each recipient. Distributing to many users or sending reports frequently may increase credit usage.
A workbook contains multiple sheets covering key financial metrics. NECCOPILOT_SUMMARIZE() is added to each sheet to generate a written narrative alongside the numbers.
Example
The workbook is structured as follows:
- Balance Sheet shows assets, liabilities, and equity.
- Balance Sheet Summary highlights key shifts in asset allocation using NECCOPILOT_SUMMARIZE().
- Profit and Loss displays revenue, expenses, and net profit.
- Profit and Loss Summary explains year-on-year trends and unusual variances using NECCOPILOT_SUMMARIZE().
- Corporate Report combines all summaries into a single narrative view alongside dashboards and visualizations.
Each summary sheet references the data sheet next to it. When the underlying data is refreshed, all summaries update automatically.
Each distribution generates a new summary per recipient. Sending to many users frequently will increase credit usage.