Pivot Wizard
The Pivot Wizard is a SEI interface that allows you to easily create a Pivot based off your own data. You can aggregate data and sort or filter it for the most relevant information. With the Pivot Wizard, you can select the data model and fields you want to analyze and automatically create a Pivot. You can find the Pivot Wizard under the Analysis tab of a Workbook.

Why use the Pivot Wizard?
-
Data summarization: Easily summarize large data sets to extract key metrics.
-
Quick analysis: Allows for fast, interactive data analysis without the need for complex formulas.
-
Flexibility: Quickly reorganize data to view it from different angles and gain new insights.
-
Aggregation: Aggregate data using various functions like SUM, AVERAGE, COUNT, etc.
-
Filtering and sorting: Easily filter and sort data to focus on the most relevant information.
What use cases can the Pivot Wizard answer?
-
Sales analysis: Summarizing sales data by product, region, or time period to identify trends and performance metrics.
-
Financial reporting: Aggregating financial data for monthly, quarterly, or annual reports.
-
Customer analysis: Analyzing customer data to identify key demographics, purchasing behaviors, and loyalty metrics.
-
Inventory management: Summarizing inventory levels by product category or warehouse location to optimize stock levels.
Pivot Wizard Properties
Fields and Options

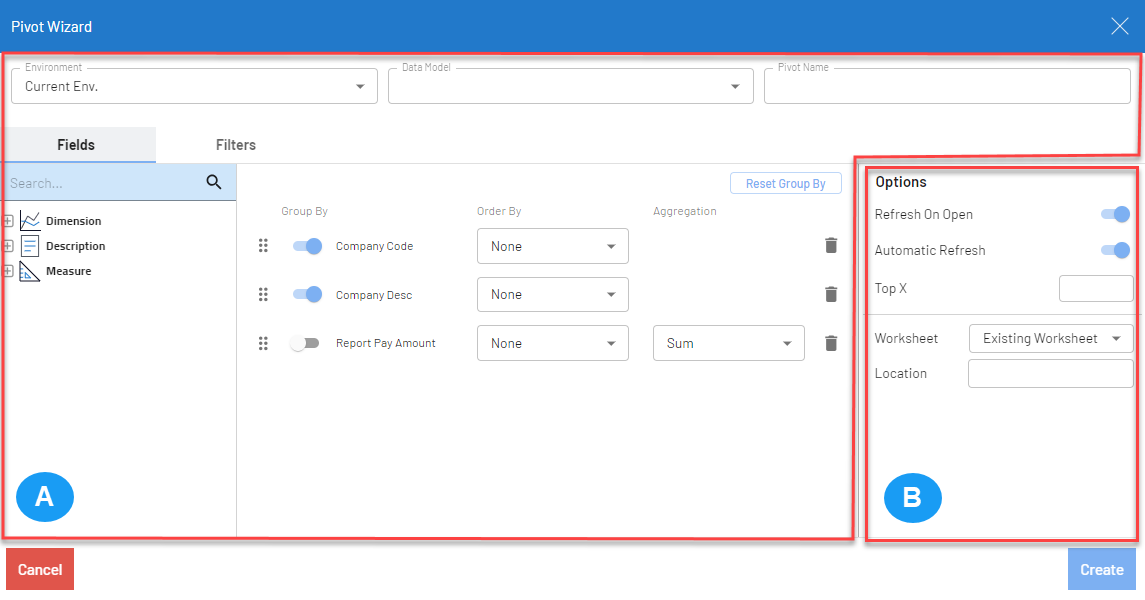
Section A of the Pivot Wizard includes the following:
| Property | Description |
| Environment | Set the environment for the pivot table. |
| Data Model | Select the data model that you want to perform a pivot analysis on. |
| Pivot Name | Create a name for the Pivot. |
| Fields |
Choose which dimensions, descriptions, and measures to add to the Pivot.
|
Section B of the Pivot Wizard includes the following:
| Property | Description |
| Refresh On Open | The Pivot refreshes automatically when the Workbook is opened (toggle to enable/disable). |
| Automatic Refresh | The Pivot refreshes automatically when a filter that references it is changed (toggle to enable/disable). |
| Top X | Choose how many rows of data you want to appear in your Pivot. |
| Worksheet | Select the worksheet where the Pivot is created. |
| Location | Set the cell location within the worksheet where the Pivot is created. |
Filters
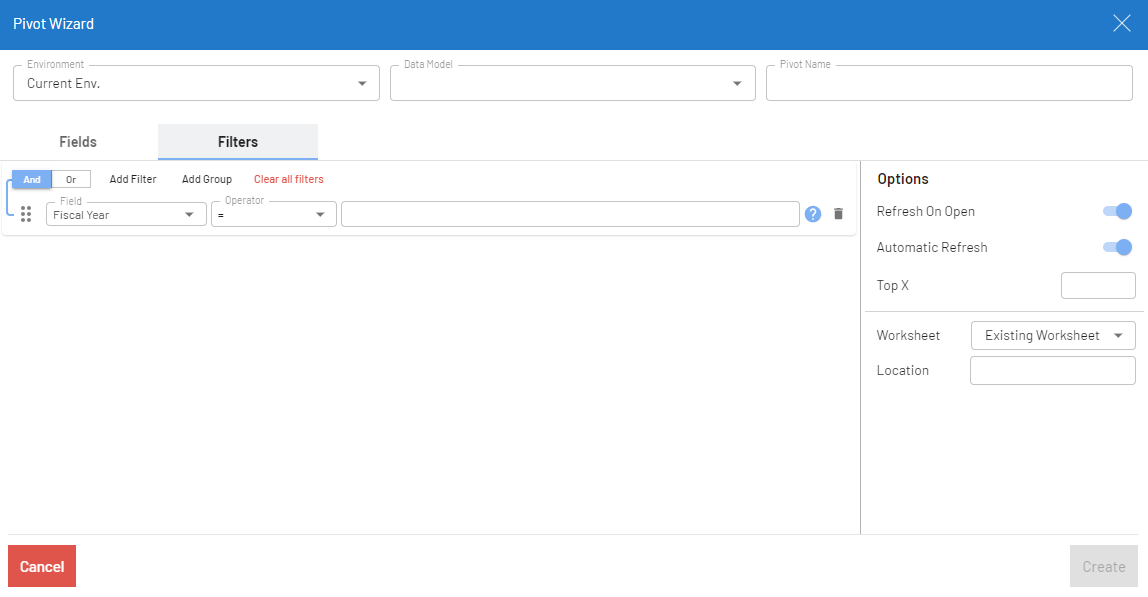
The Filters tab allows you to add more complex filters to your Pivot. Below is an image of the Filters section:

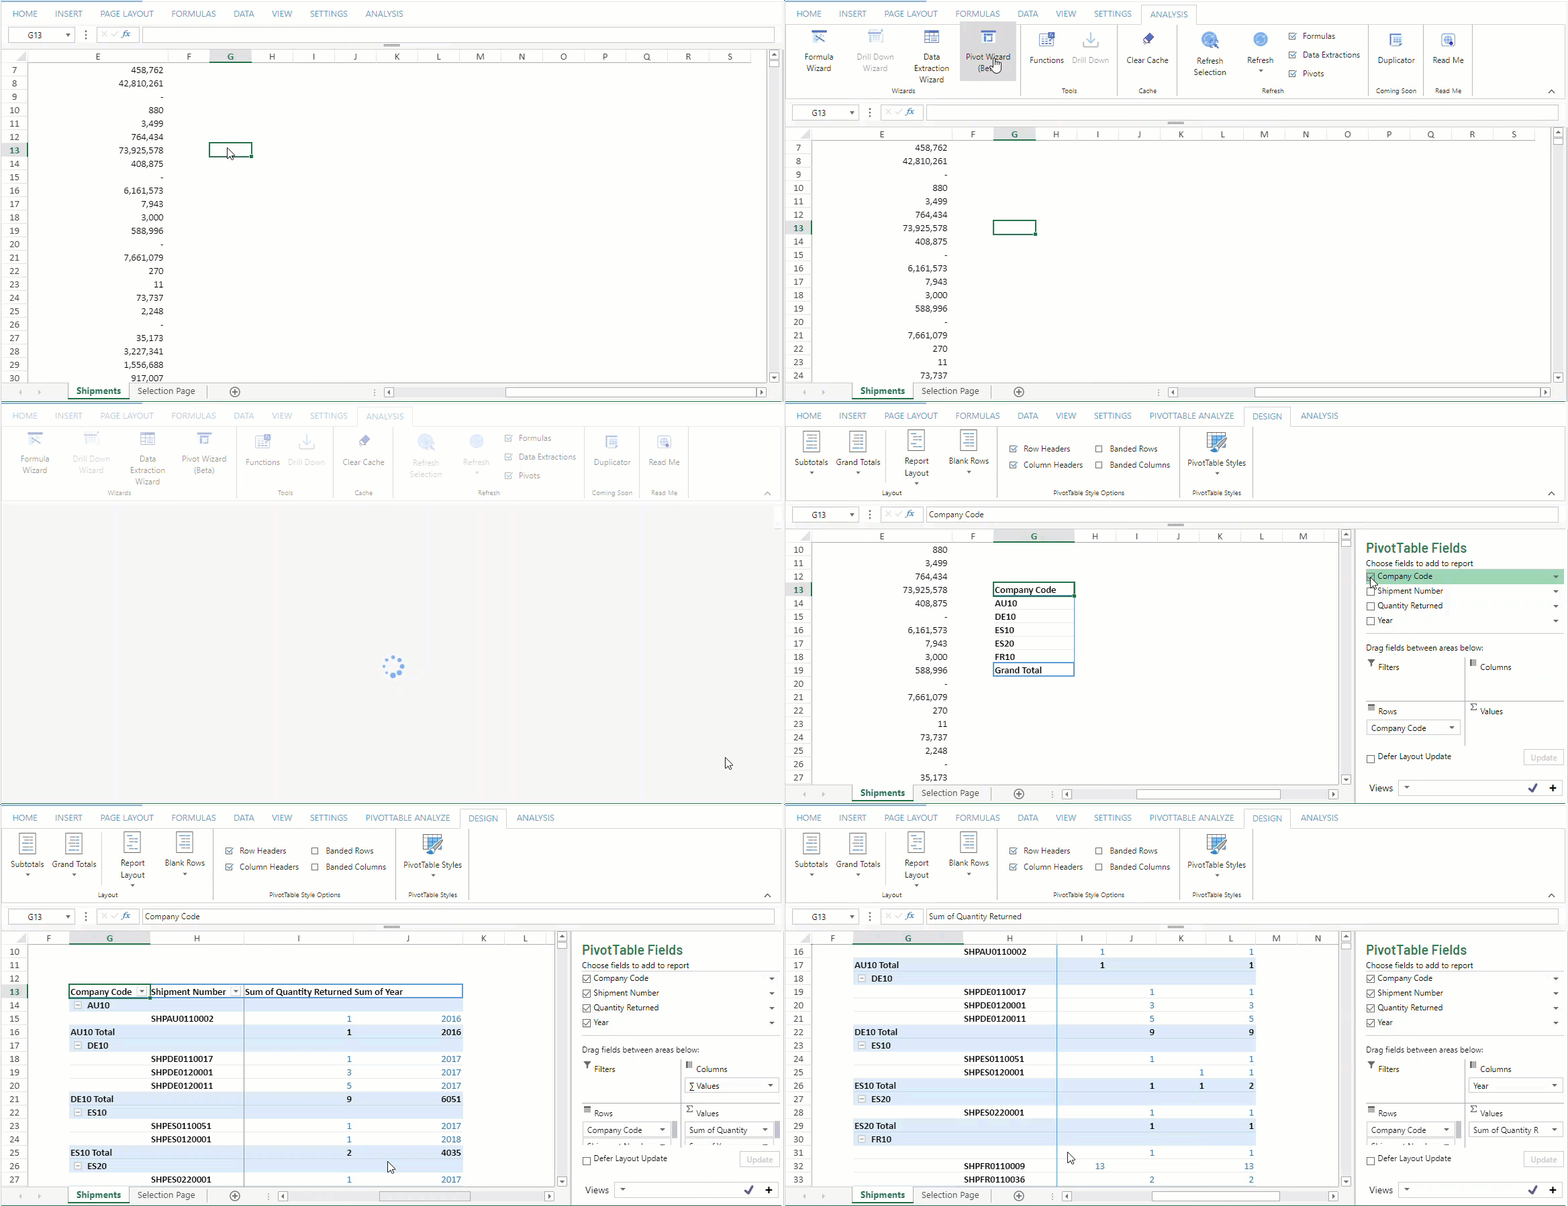
A quick look at using the Pivot Wizard:
