Scatter Sparklines
To create scatter sparklines in the workbook:
-
Click Insert from the menu.
-
Click Sparkline and select the scatter sparkline under Scatter Sparkline from the list.
-
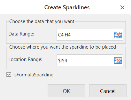
In the Create Sparklines dialog box:
-
Select a range of cells in the same row or the same column.
-
Select the cell where the sparkline will appear.
-
Click OK.
-
-
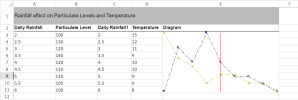
The sparkline is displayed in the cell. You can now customize the sparkline by clicking Design from the menu and selecting Settings.
-
Set the parameters as described below and click OK.
-
Copy and paste the cell as needed to finalize your scatter sparklines.
| Scatter sparkline parameter | Description |
|---|---|
| Points1 |
The first series of XY data. It is a range, such as "H1:I3".
|
| Points2 |
(Optional) The second series of XY data. It is a range, such as "H4:I6".
|
| MinX | (Optional) X minimum limit of both series; each series has its own value if it is omitted. |
| MaxX | (Optional) X maximum limit of both series; each series has its own value if it is omitted. |
| MinY | (Optional) Y minimum limit of both series; each series has its own value if it is omitted. |
| MaxY | (Optional) Y maximum limit of both series; each series has its own value if it is omitted. |
| HLine | (Optional) The position of the horizontal axis; there is no line if it is omitted. |
| VLine | (Optional) The position of the vertical axis; there is no line if it is omitted. |
| XMinZone | (Optional) X minimum value of the gray zone; there is no gray zone if any of these four zone parameters are omitted. |
| XMaxZone | (Optional) X maximum value of the gray zone; there is no gray zone if any of these four zone parameters are omitted. |
| YMinZone | (Optional) Y minimum value of the gray zone; there is no gray zone if any of these four zone parameters are omitted. |
| YMaxZone | (Optional) Y maximum value of the gray zone; there is no gray zone if any of these four zone parameters are omitted. |
| Color1 | Color string of the first series of points; the default value is "#969696". |
| Color2 | Color string of the second series of points; the default value is "#CB0000". |
| Tags | (Optional) If this option is selected, it marks the point where the Y value is the maximum of the first series as "#0000FF", and marks the point where the Y value is the minimum of the first series as "#CB0000". The default value is false (not selected). |
| Draw Symbol | (Optional) If this option is selected, it draws each point as a symbol. The symbol of the first series is a circle, and the symbol of the second series is a square. The default value is true (selected). |
| Draw Lines | (Optional) If this option is selected, it connects each point with a line by sequence in each series. The default value is false (not selected). |
| Dash Line | (Optional) If this option is selected, the line is a dashed line; otherwise, the line is a full line. The default value is false (not selected). |
|
The scatter sparkline formula has the following syntax: =SCATTERSPARKLINE(points1, points2, minX, maxX, minY, maxY, hLine, vLine, xMinZone, xMaxZone, yMinZone, yMaxZone, tags, drawSymbol, drawLines, color1, color2, dash) |
|


