Histogram Sparklines
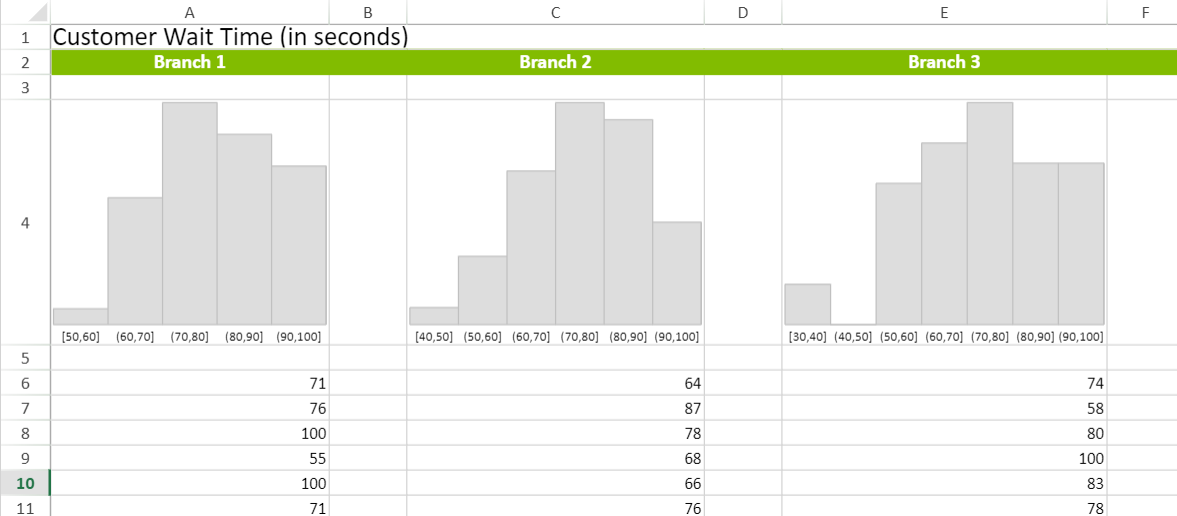
Histograms are used to represent the frequency distribution of a data set.
A histogram sparkline has the following elements:
-
Bin: The data container which contains data of the specified range of values.
-
Bar: The paint block. The bar height is determined by the following expression if the PaintLabel option is selected : cellRowHeight - labelFontSize - 6px, otherwise, it is determined by: cellRowHeight - 6px.
-
Edge: Border of the bar.
-
If the font size is more than the expression, then the largest integer less than or equal to the expression is taken as the font size.
-
If the height of the cell is less than the cell row height, the font size is 12px.
-
-
Data Label: The data range displayed in the sparkline. The data label font size is determined by the expression: Math.floor(cellRowHeight/3).
-
If the font size is more than the expression, then the largest integer less than or equal to the expression is taken as the font size.
-
If the height of the cell is less than the cell row height, the font size is 12px.
-
To create histogram sparklines in the workbook:
-
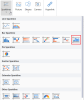
Click Insert from the menu.
-
Click Sparkline and select the histogram sparkline under Bar Sparkline from the list.
-
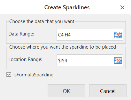
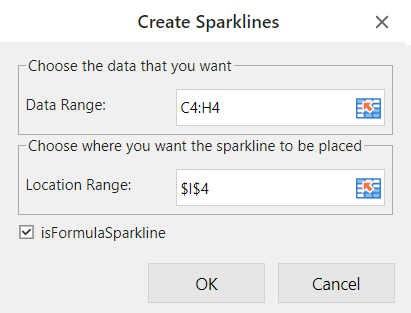
In the Create Sparklines dialog box:
-
Select a range of cells in the same row or the same column.
-
Select the cell where the sparkline will appear.
-
Click OK.
-
-
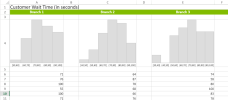
The sparkline is displayed in the cell. You can now customize the sparkline by clicking Design from the menu and selecting Settings.
-
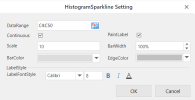
Set the parameters as described below and click OK.
-
Copy and paste the cell as needed to finalize your histogram sparklines.
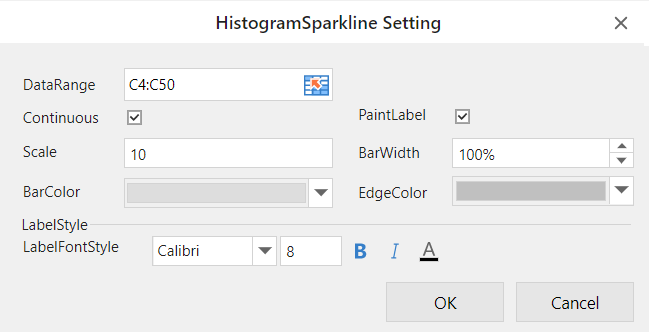
| Histogram sparkline parameter | Description |
|---|---|
| DataRange | Range or calculation array, such as "A1:C6" or "{1,2,2,3,3}". If a cell value isn't a valid number, it will be ignored. |
| Continuous |
(Optional) If this option is selected, the histogram is continuous; otherwise the histogram is discrete.
|
| PaintLabel |
(Optional) Boolean that represents whether to show the data label. |
| Scale | Number that represents the data binning width when histogram is continuous (value > 0). |
| BarWidth | Number that represents the percent of bar width according to the average bar width (value > 0 and value <= 1). |
| BarColor | String that represents the bar color. |
| EdgeColor |
String that represents the color of bar edge. |
| LabelFontStyle | String that represents the data label font style. It supports custom font style, font weight, font family, font size. |
|
The histogram sparkline formula has the following syntax: =HISTOGRAMSPARKLINE(dataRange,continuous?,paintLabel?,scale?,barWidth?,barColor?,labelFontStyle?,labelColor,edgeColor?) |
|