Gauge KPI Sparklines
To create Gauge KPI sparklines in the workbook:
-
Click Insert from the menu.
-
Click Sparkline and select the Gauge KPI sparkline under Other Sparkline from the list.
-
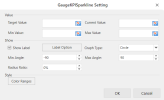
In the GaugeKPISparkline Setting dialog box:
-
Set the parameters as described below.
-
Click OK.
-
-
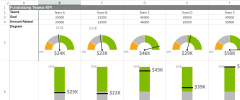
The sparkline is displayed in the cell. To edit the sparkline, click Design from the menu and select Settings. The GaugeKPISparkline Setting dialog box will be displayed again.
-
Copy and paste the cell as needed to finalize your Gauge KPI sparklines.
| Gauge KPI sparkline parameter | Description |
|---|---|
| Target Value | [Number] The target value in the gauge KPI sparkline; it is between minValue and maxValue. |
| Current Value | [Number] The current value in the gauge KPI sparkline; it is between minValue and maxValue. |
| Min Value | [Number] The minimum value in the gauge KPI sparkline; it is less than maxValue. |
| Max Value | [Number] The maximum value in the gauge KPI sparkline; it is bigger than minValue. |
| Show Label |
(Optional) Specifies whether the value labels should be displayed:
|
| Label Option |
(Optional) Opens the GaugeKPISparkline Label Option dialog box where you can set these label and font values:
|
|
Graph Type (gaugeType) |
The KPI sparkline type:
|
| Min Angle |
The minimum angle value of Circle type. The minAngle should be less than maxAngle.
|
| Max Angle |
The maximum angle value of Circle type. The maxAngle should be bigger than minAngle.
|
| Radius Ratio |
The inner circle radius divided by the outer circle radius is the radiusRatio (between 0 and 1). It only works when the gaugeType is 0 (circle). The default value of radiusRatio is 0. The outer circle radius value is decided by the cell size. |
| Style (colorRange) |
Opens the GaugeKPISparkline Style Setting dialog box where you can set the Start Value, End Value, and Color for the special color range:
|
|
The Gauge KPI sparkline formula has the following syntax: =GAUGEKPISPARKLINE (targetValue, currentValue, minValue, maxValue,showLabel?,targetValueLabel?,currentValueLabel?,minValueLabel?,maxValueLabel?, fontArray?, minAngle?, maxAngle?, radiusRatio?, gaugeType?, colorRange?) |
|

