Column Sparklines
To create column sparklines in the workbook:
-
Click Insert from the menu.
-
Click Sparkline and select the column sparkline under Bar Sparkline from the list.
-
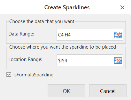
In the Create Sparklines dialog box:
-
Select a range of cells in the same row or the same column.
-
Select the cell where the sparkline will appear.
-
Click OK.
-
-
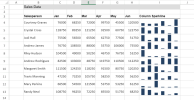
The sparkline is displayed in the cell. You can now customize the sparkline by clicking Design from the menu and selecting Settings.
NoteIf you removed the default option isFormulaSparkline in the previous step, the sparkline is not saved as a function and thus the function does not appear in the fx line. After clicking Design from the menu, the Settings button is replaced by several options. You can customize the sparkline using these options, such as changing the type of sparkline (Line, Column, or WinLoss), controlling which value points are shown (such as high, low, first, last, or any negative values), applying styles, and controlling whether to show the horizontal axis. You can highlight individual data markers (values) in a column sparkline by making some or all of the markers visible.
-
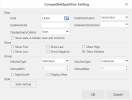
Set the parameters as described below and click OK.
-
Copy and paste the cell as needed to finalize your column sparklines.
| Column sparkline parameter | Description |
|---|---|
| Data | |
| Data | A range reference that represents sparkline data, such as A1:C3. |
| Data Orientation |
A number that represents the sparkline data orientation:
|
| DateAxisData | (Optional) A range reference that represents sparkline date axis data, such as D1:F3. |
| DateAxisOrientation |
(Optional) A number that represents the sparkline date axis orientation.
|
| DisplayEmptyCellsAs |
Option to display empty cells as:
|
| Show data in hidden rows and columns | (Optional) Select the option to show hidden data. |
| Show | |
| Show First | Specifies whether the first data point is formatted differently for each sparkline in this sparkline group. |
| Show Last | Specifies whether the last data point is formatted differently for each sparkline in this sparkline group. |
| Show High | Specifies whether the data points with the highest value are formatted differently for each sparkline in this sparkline group. |
| Show Low | Specifies whether the data points with the lowest value are formatted differently for each sparkline in this sparkline group. |
| Show Negative | Specifies whether the negative data points are formatted differently for each sparkline in this sparkline group. |
| Show Markers | Specifies whether data markers are displayed for each sparkline in this sparkline group. |
| Group | |
| MinAxisType |
Defines the minimum axis type for the group:
|
| ManualMin |
Becomes available when MinAxisType is set to Custom. Enter the desired number; for example, -3. |
| MaxAxisType |
Defines the maximum axis type for the group:
|
| ManualMax |
Becomes available when MaxAxisType is set to Custom. Enter the desired number; for example, 5. |
| RightToLeft | Reads the sparkline data range values from right to left and adjusts the sparkline accordingly. |
| DisplayXAxis | Displays the X axis. |
| Style | |
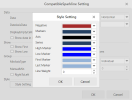
| Style Setting |
Allows you to change the color of the following items:
|
|
The column sparkline formula has the following syntax: =COLUMNSPARKLINE(data, dataOrientation, dateAxisData, dateAxisOrientation, setting) |
|


