Box Plot Sparklines
To create Box Plot sparklines in the workbook:
-
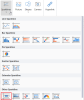
Click Insert from the menu.
-
Click Sparkline and select the Box Plot sparkline under Other Sparkline from the list.
-
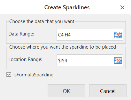
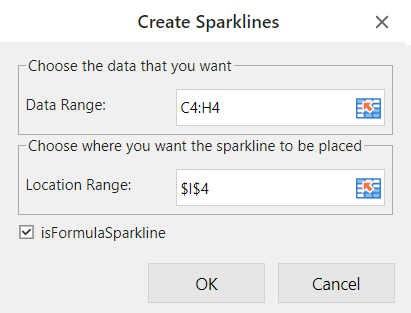
In the Create Sparklines dialog box:
-
Select a range of cells in the same row or the same column.
-
Select the cell where the sparkline will appear.
-
Click OK.
-
-
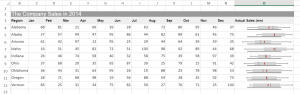
The sparkline is displayed in the cell. You can now customize the sparkline by clicking Design from the menu and selecting Settings.
-
Set the parameters as described below and click OK.

-
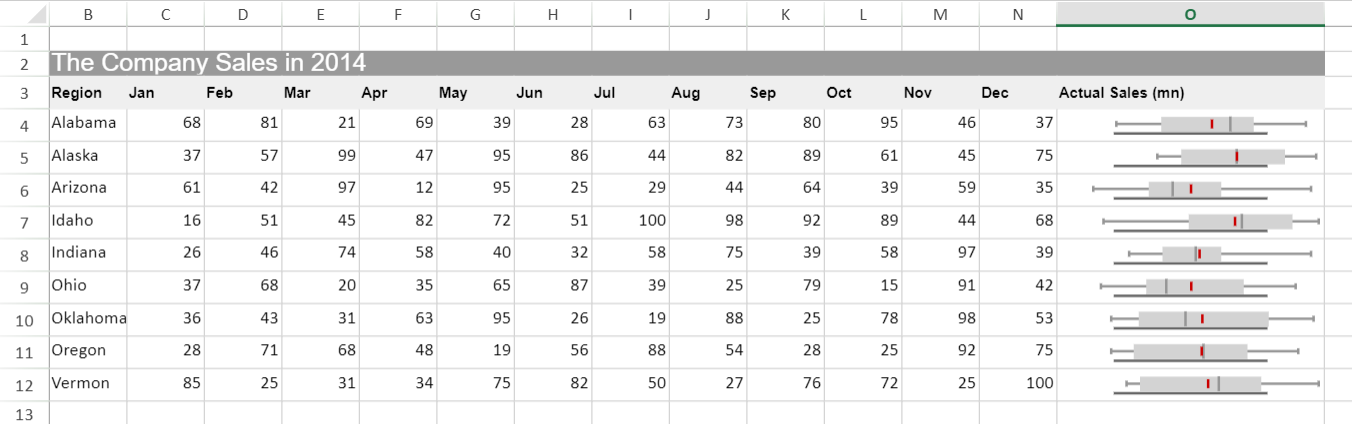
Copy and paste the cell as needed to finalize your Box Plot sparklines.
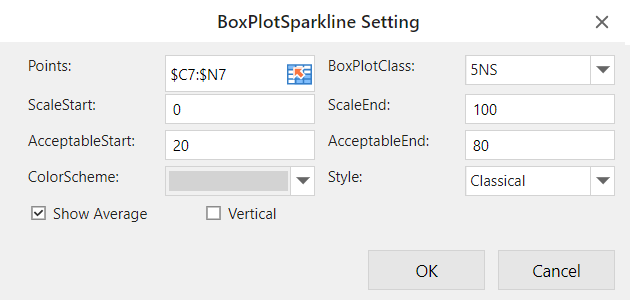
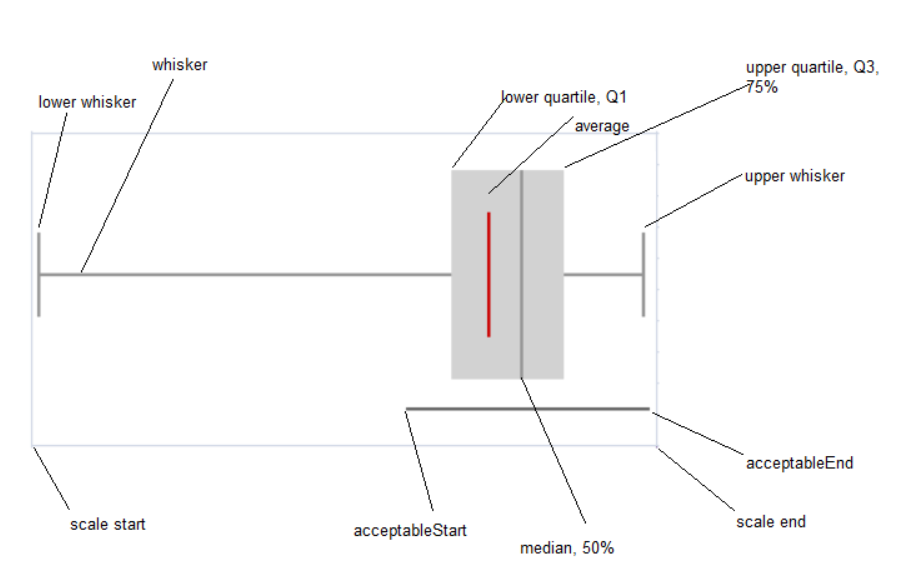
| Box Plot sparkline parameter | Description |
|---|---|
| Points | Reference that represents the range of cells that contains the values, such as "A1:A4". |
| BoxPlotClass |
Class of the box plot:
|
| ScaleStart | (Optional) Number or reference that represents the minimum boundary of the sparkline, such as 1 or "A6"; the default value is the minimum of all values. |
| ScaleEnd | (Optional) Number or reference that represents the maximum boundary of the sparkline, such as 8 or "A7"; the default value is the maximum of all values. |
| AcceptableStart | (Optional) Number or reference that represents the start of the acceptable line, such as 3 or "A8"; the default value is null. |
| AcceptableEnd | (Optional) Number or reference that represents the end of the acceptable line, such as 5 or "A9"; the default value is null. |
| ColorScheme | String that represents the color of the sparkline's box; the default value is "#D2D2D2". |
| Style |
Number or reference that represents the style of the box plot sparkline.
|
| Show Average | (Optional) Boolean that represents whether to display the average. The default value is false. |
| Vertical | (Optional) Boolean that represents whether to display the sparkline vertically. The default value is false. |
|
The box plot sparkline formula has the following syntax: =BOXPLOTSPARKLINE(points, boxPlotClass, showAverage, scaleStart, scaleEnd, acceptableStart, acceptableEnd, colorScheme, style, vertical) |
|