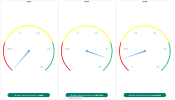
Gauges
The Gauge View is a simple tool to display critical and important values that are often displayed in
Dashboards. This useful tool helps define the gauges appearance and offers a variety of features to
customize the content and the layout of your gauge.

| Property | Description |
|---|---|
|
General |
|
|
Type |
To select the type of gauge. |
|
Border |
To turn the border option on or off. |
|
Auto-fit |
When this option is activated, the size of each individual gauge is automatically adjusted to fit in the number of columns defined. |
|
Reverse Data |
To reverse the data of the gauge for displaying purposes (reverses positive and negative values). |
|
Size (if auto-fit deactivated) |
To enter a fixed size for each individual gauge. |
|
Show First |
To determine how many gauges will be displayed based on a specific amount of records retrieved. |
|
Theme |
|
| Select a theme. | |
|
Labels & Tooltips |
|
|
Visible |
To view the label (group information) of every gauge. |
|
Location |
To choose between top or bottom. |
|
Font Size |
To choose a text size and color for the label. |
|
Group Color |
|
|
Header and Footer |
|
|
Visible |
To display or hide the header or footer. |
|
Text |
To enter header/footer information to display. |
|
Font Size |
To choose a text size and color for the header/footer. |
|
Color |
|
|
Legend |
|
|
Location |
To select where the legend is displayed (top or bottom). |
|
Visible |
To display or hide the legend of every gauge of this view. |
|
Background color |
To choose a text and background color for the legend. |
|
Font Color |
|
|
Scale |
|
|
Auto scale |
To automatically calculate the scale for every gauge, filling in the minimum and/or the maximum values for the scale when this option is On. |
|
Field |
If Auto-scale is turned off, choose a field for the max value of the gauge, the subsequent scale will be calculated, thus creating a dynamic limit making it easy to visualize other Fields as a percentage of the chosen Field. |
|
Major Ticks |
Number of ticks after the zero. Major ticks have a label with abbreviated values. |
|
Minor Ticks |
Number of spaces between two major ticks. Minor ticks are shorter than the major ticks and do not have labels. |
|
Font Size |
Font size of the scale labels. |
|
Location |
To display inside or outside the gauge (Circular Gauges only). |
|
Ranges |
|
|
Width |
To enter a value between 1 and 30 that defines the width of the gauge itself. |
|
Range 1-5 |
To define up to 5 ranges around the gauge. Choose the color of these ranges in these properties. |
|
Max |
The Max value for each range is the higher end of the range expressed in percentage of the gauge. The highest range should have a 100% max value, and it is set within less than 5 ranges, the following ones are ignored. |
|
Indicators |
|
|
Auto Scale |
To automatically calculate the scale for every gauge when this option is On. |
|
Limits Visible |
Toggle on or off. |
|
Value |
To select the appropriate value. |
|
Show as Percentage |
Toggle on or off. |
|
Abbreviate |
Toggle on or off. |
|
Show Needle |
Toggle on or off. |
|
Auto Refresh |
|
|
Groups |
|