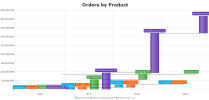
Waterfall
A Waterfall chart is a graph type that represents a running total of values that are added or subtracted. You can easily view how a starting value is changing over time periods (with positive and negative values) and see the end result.
