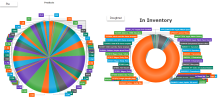
Pie and Doughnut
In a Pie or Doughnut chart only one measure at a time can be represented. The measure is defined in the Series property. It has no X or Y axis, and no marked zone can be set.
| Setting | Description |
|---|---|
| General | |
|
Thickness (For Doughnut chart) |
Adjusts the thickness of the chart. |
| Labels & Tooltips | |
|
Show Labels |
Defines whether or not labels are shown over the displayed bar/point/sector and to define the formatting of the label. |
|
Show Percentage of Total |
When enabled, it allows you to display the total of each group on the chart as percentage. For more accuracy, you can use the Decimal Places option. |
|
Type |
The labels can be made with the value or the text or both. |
|
Format |
The value can be displayed numerically, abbreviated (rounded to K’s and M’s), or by percentage. |
|
Decimal Places |
Select a number of decimals to display for a numeric or percentage format. |
|
Show Line Points (Lines, radar and polar only) |
To show or hide the points on the lines. |
| Total (for Doughnut chart) | |
|
Show Total |
When enabled, it allows you to reveal the total from the values in the chart. |
| Format | To choose if you want the total to be displayed shortened (Abbreviate) or fully (Numeric). If you select Numeric, the Decimal Places option will be available for you to choose a number of decimals to display. |
| Font Color | To choose a color for the font of the total. |
| Bold | To apply bold on the total. |
| Italic | To apply italic on the total. |
| Show Specific Title | To define a specific title for the total. |
| Position | To place the title for the total at the Top or at the Bottom. |
| Font Color | To choose a color for the title font of the total. |
| Bold | To apply bold on the title for total. |
| Italic | To apply italic on the title of the total. |
| Series | |
|
Slice Field Name |
To indicate the measure on which the chart is created. |
