Window Function Examples
This topic provides examples of:
Examples of Running Total (Aggregate functions)
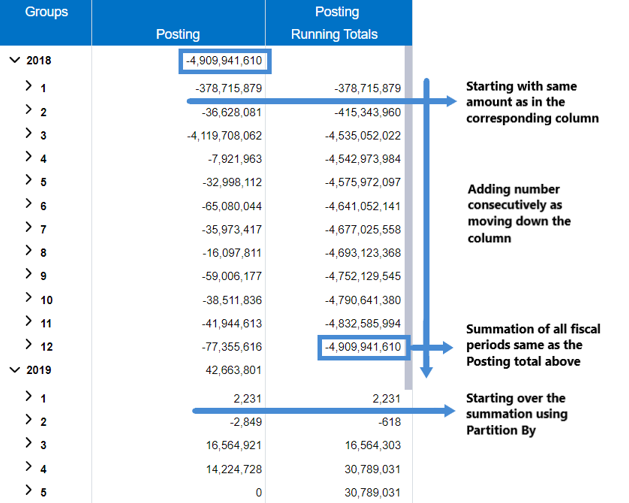
A running total is the summation of a sequence of numbers that is updated continuously as a new number is added to the sequence. The SUM function cumulates the rows based on the Order By. It can break the addition and start over based on the Partition By.
The SUM function helps with easily stating the totals at any given time without the need of adding the entire sequence of numbers. This function can be very useful in tracking the accumulation of various metrics over time; for example, registered users of a product, cash register operations, inventory, etc.
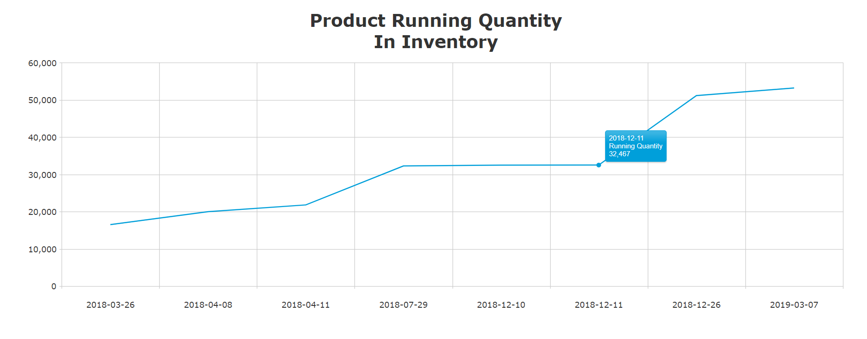
The image below shows the accumulation of a product quantity over time; the total inventory on 2018-12-11 is 32,467.
Examples of Lags and Leads (Value functions)
Lag is the amount of time a successor activity will be delayed with respect to a predecessor activity, while Lead is the amount of time a successor activity can be advanced with respect to its predecessor. The LAG function fetches the data from the previous row while the LEAD function fetches it from the subsequent row.
Note: These functions are not only limited to time; they can be used in many other ways.
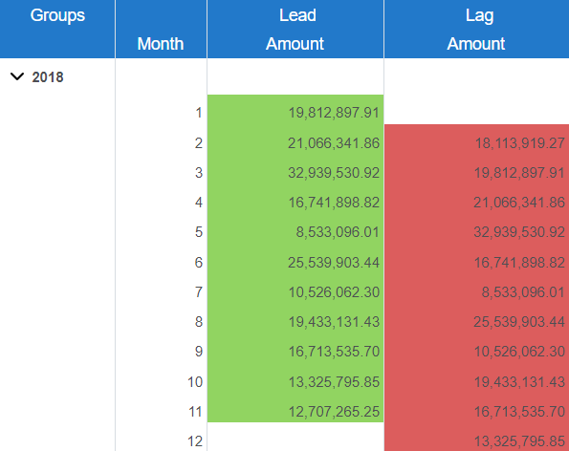
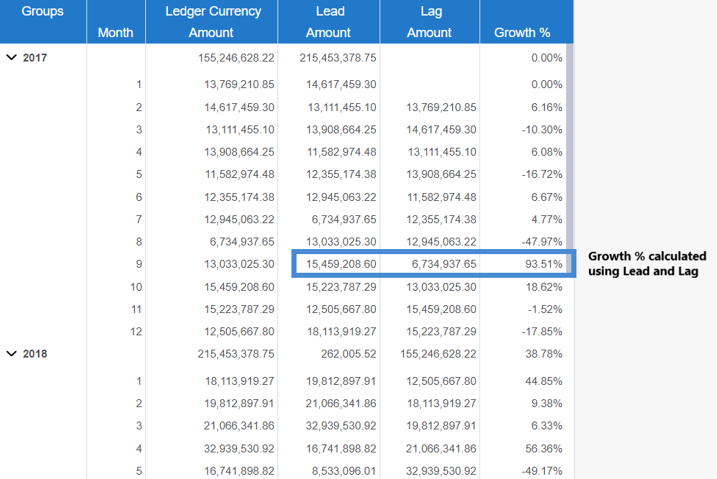
We can use LAG and LEAD functions to calculate many important KPIs that could be useful in deeper analysis. With lags and leads on the same row, it becomes easier to do calculations such as growth percentage of sales between two months. In the example below, we calculate Growth % in sales amount for Month 9 , i.e. 93.51%.
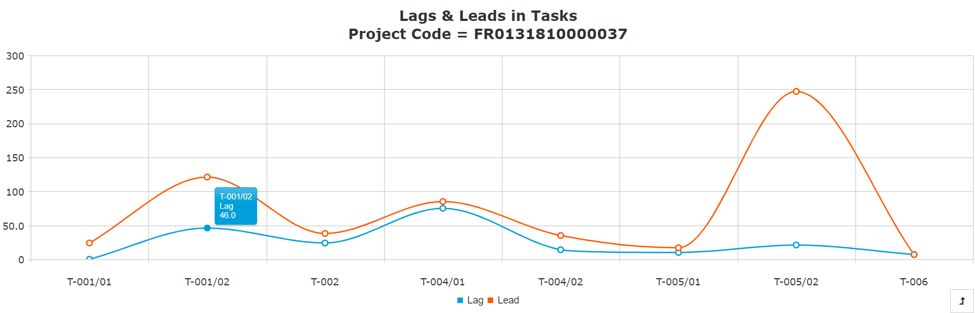
Lags and Leads can also be very useful in understanding the pattern of activities over time which can further help us in scheduling activities and further optimize them. The graph below shows the lags and leads calculated based on the start and end dates of different tasks involved in a project. There is a lag of 46 days between tasks T-001/02 and T-002.
Examples of Ranking Functions
Some of the most common ranking functions are as follows:
-
ROW_NUMBER: This function returns a unique number for each row within a partition, with different number for equal values.
-
RANK: This function returns the rank of a number relative to the other value sin the list, with gaps and same ranking for equal values.
-
DENSE_RANK: This function returns the rank of a number with no gaps and same ranking for equal values.

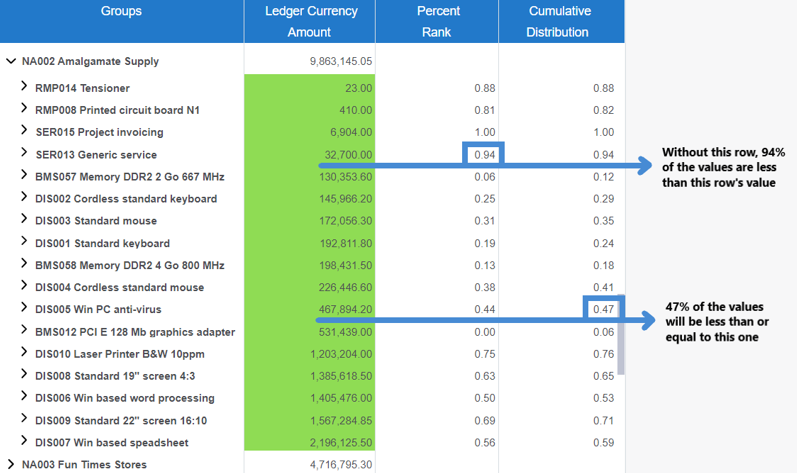
Some ranking functions are used for distribution to provide the probability of an event based on a set of values. The most common ranking functions used for distribution are as follows:
-
PERCENT_RANK: This function returns the rank of a value in a data set as a percentage of the data set. For example, it can be used to evaluate the sales percentage for a particular product among all the sales.
-
CUME_DIST: The cumulative distribution function is used to determine the probability that a random observation taken from the data set will be less than or equal to a certain value.