Report Creation
Before starting on any report creation, it’s important to understand that all accounting entries in the UDM follow this rule: Debit transactions are always positive, and Credit transactions are always negative.
Remembering this rule is important because it impacts the way financial reports are built.
When you import the template, four Reports are provided. These Reports are very basic as they give a summary view of the available information and are mostly used in Dashboards.
We highly recommend creating new reports to meet your specific reporting needs rather than modifying these Reports .
Understanding the structure of the Report
Before we start creating a Report, let's first look at a what a Report consists of, by using a basic Report as an example.
- In the Data Models and Views tab, expand the Universal Data Model and the Configuration folders.
- Expand the Report Builder data model and open the Report Blueprint view.
- In the Report Code field, click on the Prompt icon (the question mark) to select the code of the Report you want to generate and click on Confirm.
Here, we selected the DEF_BS report. As you can see below, the Report Code is used as a filter.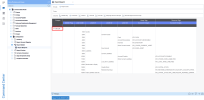
Now that our Report is open, we can also see the Columns.
Delete Flag Column
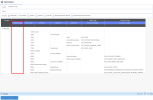
The Delete Flag column is used to specify which row(s) you want to remove.
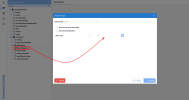
This action is performed through the Info Page of the Report Builder data model, under the Delete Rows section (refer to Deleting lines in the Report for more details).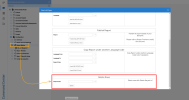
Line Order Column
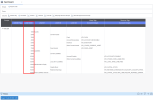
The Line Order column is used to specify the order of the lines in the Report.
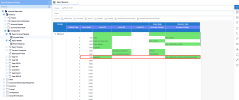
For more on how to add a line (refer to Adding lines to the Report) at the end and give a Line Order between two lines, e.g. 1500.
Level Columns
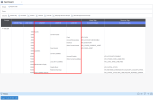
The Level columns are used to give a hierarchy regarding the display of data in the Report.
The basic view comes with 3 levels, but can use up to 10 levels if needed.
Account Groups Columns
The Account Groups columns are used to map the corresponding Account Groupings to each section of the Report.
An Account Grouping can only be associated with the lowest levelin the hierarchy.
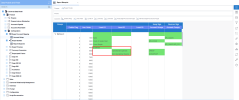
In this screenshot, we can't map any Account Groupings to the Current Assets, because the Current Assets have a lower level.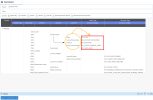
The Account Groups columns have two sections: Keep Sign and Reverse Sign.
Account Groupings assigned to the Keep Sign column will keep their original sign number (meaning if they refer to a Debit account, they will stay positive). Asset accounts are an example of this, as they are also Debit accounts.
Account Groupings assigned to the Reverse Sign column will have their original sign number inverted (meaning if they are a Credit account they go from negative to positive). Sales accounts are an example of this, as they are Credit accounts that appear with negative values that are then set to positive when they are placed in this column.
By combining Account Groupings separated by commas, the following section will help you make subtotal lines in Reports.
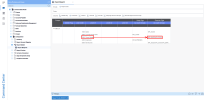
Here we are using the DEF_IS report and we want a subtotal line for the Gross Margin:
For the calculation, we will use the Account Groupings of Sales and Cost Of Goods Sold (COGS).
- Sales accounts (meaning Credit accounts), appear with their value set to negative so we will insert this Account Grouping into the Reverse Sign column.
- Since the Cost Of Goods Sold (COGS) are debitor accounts, reversing them will make them negative.
- By adding the reversed Sales (Credit) and reversed COGS (Debit), we bet positive Gross Margin in the case of profit and a negatve in the case of loss.
The values:
- -1000$ = Sales.
- 500$ = Cost Of Goods Sold (COGS).
What the result looks like:
-1000$ (reversed) becomes 1000$
500$ (reversed) becomes -500$
The 500$ becomes -500$ because the Account Grouping of Cost Of Goods Sold (COGS) has been set in the Reverse Sign column for the calculation of the Gross Margin.
So the Gross margin will be 1000$ - 500$ so 500$.
Adding lines to the Report
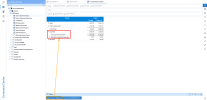
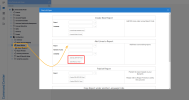
By default, a Report is created with 100 lines. If this number is insufficient it is possible to add lines via the Info-Pages.
- In the Data Models and Views tab, expand the Universal Data Model and the Configuration folders.
- Right-click on the Report Builder data model and select View Info Pages.
- Under the Add Lines to Report section, click on the Prompt icon (the question mark) to select the Report for which you want to add lines and click on Confirm.
- In the Number of Lines field, enter the number of lines you want to add.
- In the Language field, click on the Prompt icon (the question mark) to select / specify the language of the report for which the lines are added.
- Click on the Add associated with your (SQL or Oracle) server to finish.
Publishing the Report
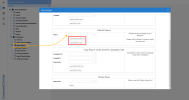
To make a Report available (to modify it afterwards for example), you need to publish it.
- In the Data Models and Views tab, expand the Universal Data Model and the Configuration folders.
- Right-click on the Report Builder data model and select View Info Pages.
- Under the Publish Report section, click on the Prompt icon (the question mark) to select the Report you want to publish and click on Confirm.
- Click on the Publish associated with your (SQL or Oracle) server to finish.
Copying the Report under another language code
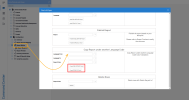
The Report Creation feature supports multiple languages. This is useful if you If you are asked to provide the same Report but in a different language.
- In the Data Models and Views tab, expand the Universal Data Model and the Configuration folders.
- Right-click on the Report Builder data model and select View Info Pages.
- Under the Copy Report under another Language Code section, click on the Prompt icon (the question mark) to specify the Language of the Report you want to copy (in the Language From field) and in which language you want the copied Report to be translated (in the Language To field) and click on Confirm.
- In the Report Code field, click on the Prompt icon (the question mark) to select the code of the Report you want to copy and click on Confirm.
- Click on the Copy associated with your (SQL or Oracle) server to finish.
Deleting lines in the Report
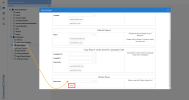
To remove a line in the Report:
- In the Report, simply enter 1 in the rows of the Delete Flag column.
- In the Data Models and Views tab, expand the Universal Data Model and the Configuration folders.
- Right-click on the Report Builder data model and select View Info Pages.
- Under the Delete Rows section, click on the Prompt icon (the question mark) to select the code of the Report you want to remove the line(s) and click on Confirm.
- Click on Delete to finish.
Example of Report creation
Example Overview
In this example, we will create an Income Statement report similar to what is provided by the template, but we will define a hierarchy to separate operational expenses from non-operational expenses.
In the Chart of Accounts we use, accounts for operational expenses will start with the number 5 and those for non-operational, with a 7.
Creating the Report
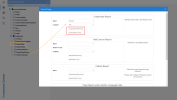
- In the Data Models and Views tab, expand the Universal Data Model and the Configuration folders.
- Right-click on the Report Builder data model and select View Info Pages.
- Under the Create New Report section, in the Report field, enter MyReport.
- In the Language field, click on the Prompt icon (the question mark) to select the languageof this Report.
- Click on the Create associated with your (SQL or Oracle) server to finish.
Defining the Report
- Under the Report Builder data model, open the Report Blueprint view.
- In the Report Codefield, click on the Prompt icon (the question mark) to select the report you have created and click on Confirm.
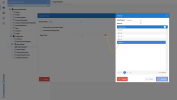
- In the Selection Page window, click on Confirm to finish.
Now, add the same lines found in the default report.
Then, use the Account Groups columns to map the Account Groupings to the Report.
The Keep Sign column will keep the Accounts Receivable (Debit account) as a positive value whereas the second column,Reverse Sign), will reverse the sign of the Accounts Payable (Credit account) so it appears as a positive value.
Creating a subtotal as Gross Margin
To create a subtotal as Gross Margin, you can use two Account Groupings separated by a comma.
Depending on the column put in the Account Groupings, the second grouping will add up or subtract.
For example, if the Sales and Costs of Goods Sold (COGS) are put in the Reverse Sign column:
Sales (a Credit account) will become positive.
COGS , a Debit account, will become negative.
The addition of the two Account Groupings will display a positive gross profit and a negative gross loss.
Creating a hierarchy for Expenses
In this section, we will define a hierarchy for expenses, more specifically, a level for general expenses and another level for operational and non-operational expenses.
In the Level 01 column we will put Expenses and for the Level 02 column, Operational and Non-operational expenses.
No Account Group is associated with the Expenses row as Account Groupings are only associated with the lowest hierarchical levels of the report and never with the parent.
To retrieve the accounts for the Operational and Non-operational expenses, we need to create two new Account Groupings.
- In the Data Models and Views tab, expand the Universal Data Model and the Configuration folders.
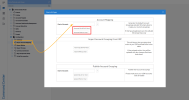
- Right-click on the Report Account Mapping data model and select View Info Pages.
- In the Charts of Accounts field, click on the Prompt icon (the question mark) to select the Charts of Accounts code for which you want to generate an Account Grouping.
- In the Filter for field, look for the code corresponding to the country from which you want to retrieve data (NA for North America in this example) and press the Enter key.
- Select the code and click on Confirm.
- Click on the Generate associated with your (SQL or Oracle) server.
- The generated list of an Account Grouping will be inserted in the Account Setup view.
- Expand the Report Account Mapping data model to open the Account Setup view.
- Expand the Group corresponding to your country.
- In the Grouping column, add OPEXP for Operational Expenses and NONOPEXP for Non-Operation Expenses to comply with the references we entered above.
- In the first Accounts column, enter 5* for Operational Expenses and 7* for Non-Operation Expenses and save your changes.
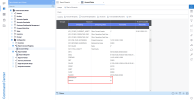
Do not insert any space for the code in the Grouping column.
Adding the Net Profit line
Finally, to complete this report, we add the Net Profit line as shown below:
Publishing the Account Groupings and Report
To view our new report, we must first publish our two new Account Groupings. In order to do so:
- In the Data Models and Views tab, expand the Universal Data Model and the Configuration folders.
- Right-click on the Report Account Mapping data model and select View Info Pages.
- Under the Publish Account Grouping section, in the Charts of Accounts field, we enter NA1 as we added the Account Groupings here for this example.
- Click on the Update associated with your (SQL or Oracle) server to finish.
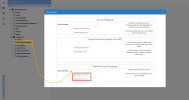
Now publish the report so it can be accessible:
- In the Data Models and Views tab, expand the Universal Data Model and the Configuration folders.
- Right-click on the Report Builder data model and select View Info Pages.
- Under the Publish Report section, in the Report field, we enter MyReport for this example.
- Click on the Publish associated with your (SQL or Oracle) server to finish.

Using the Report
To use the report, open the Income Statement Report view.
- Under the Finance data model, open the Income Statement Report view.
- In the Selection Page window, define the settings you want to apply such as Fiscal Year, Currency etc and click on Confirm.
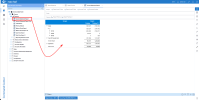
- At the bottom of the screen, under the Filters section, click on the Report Code tile and select Edit Filter (pencil icon).

- In the Advanced Filter window, click on the pencil.
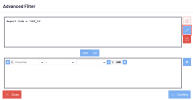
- Replace the report code (DEF_IS in this case) with the code of the report we have created earlier (MyReport in this example).
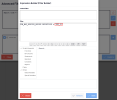
- Click on Validate to check for errors, then on Save.
- Back in the view, the report created is now displayed and the hierarchy we defined regarding Expenses is respected.
