Payroll & Workforce Dashboard
The Payroll & Workforce Dashboard provides a centralized, month-over-month view of payroll costs and employee metrics. Designed for HR, Payroll, and Finance teams, it helps monitor trends, control costs, and manage workforce dynamics. Decision-makers gain high-level KPIs and detailed breakdowns for tracking changes in real-time.
The dashboard streamlines payroll and workforce cost monitoring with interactive filters, MoM variance indicators, and a clean interface—enabling proactive management and strategic HR planning in one comprehensive view.
Key metrics at a glance
| KPI | Description | MoM Variance Indicator |
|---|---|---|
| Total Salary Cost | Total gross payroll cost for the selected month. | Green if decreased; Red if increased |
| Net Pay | Take-home pay after deductions and taxes. | Green if optimized or stable; Red if unexpectedly higher |
| Avg. Cost per Employee | Total salary cost divided by number of active employees. | Green if reduced; Red if rising |
| Company Contributions % | Employer contributions (UIF, medical, etc.) as % of total payroll. | Green if efficient; Red if spike |
| Overtime % | Overtime payments as a percentage of total payroll. | Green if controlled; Red if increased |
| Active Headcount | Number of employees paid during the month. | Green if stable/increasing; Red if dropped |
Benefits of this dashboard
-
Real-Time Visibility: Track payroll performance and staff costs at a glance.
-
Early Anomaly Detection: Automated variance highlights spot unexpected changes.
-
Budget Control: Insights into average cost and company contributions aid budgeting.
-
Workforce Monitoring: Headcount and overtime trends reveal workforce dynamics.
-
Data-Driven Decisions: Align HR and Finance strategies using actionable data.
Filtering
You can interactively filter data to analyze specific segments:
-
Time Filters: Year, Month
-
Organizational Filters: Company, Department, Province, Branch
-
Employee Filters: Job Grade, Job Title
-
MoM Change Threshold: Highlight significant month-over-month changes
Filters dynamically update all visuals and KPIs for tailored analysis.
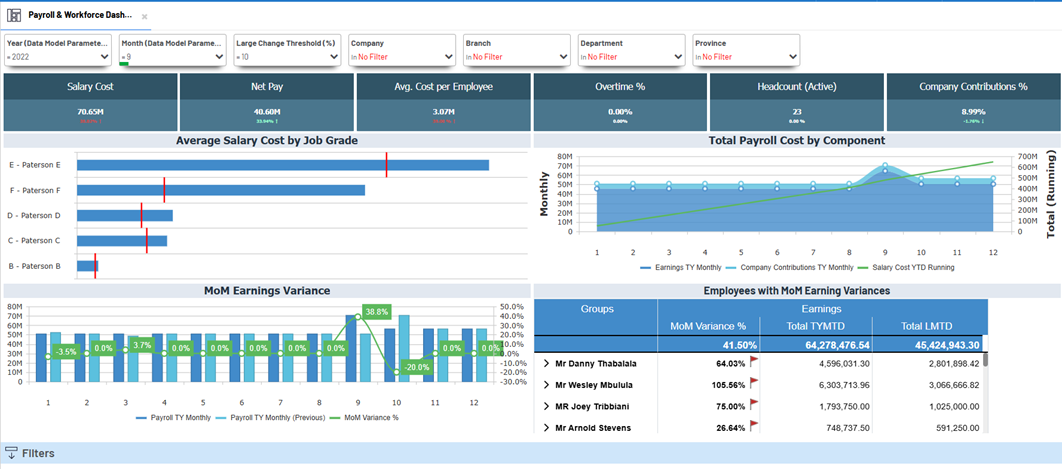
Visuals and Charts
This dashboard includes:
-
KPI Scorecards with MoM variance indicators
-
Salary Cost by Job Grade bar chart
-
Payroll Breakdown by Component (e.g., Net Pay, Contributions)
-
MoM Variance Trend chart for key payroll metrics
-
Employee-Level Variance Table with dynamic sorting
Example