Manual Adjustments after the Conversion
After the conversion you can take the Excel files from the Output folder and move them to the desired network location to be shared to all your users. When opening the reports for the first time, you need to make these manual adjustments:
-
You may have to manually change some formulas if you were doing VLookup or simple cell references to the Parameters sheet in the SI report. The Parameters sheet is not structured exactly the same way in SEI, so you may have to change the formulas to point to the proper cell. This step is optional and not all reports use such formulas.
-
Before running any data extraction refresh, you need to put values in the Parameters sheet for the different filters and parameters.
-
Refer to the examples below when a report is opened for the first time: Sales Master and Financial Designer.
Example of Sales Master 3-3 (AE-SQL)
The Sales Master 3-3 (AE-SQL) report is part of the Sage 300 demo reports. This report was created in Sage Intelligence with a simple container with a data dump and a few filters are required to run the reports.
To make manual adjustments to the Sales Master 3-3 (AE-SQL) report:
-
Open the Sales Master 3-3 (AE-SQL) Excel file in the Output folder.
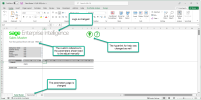
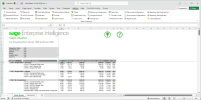
There is no data loaded yet because no refresh has been done. The conversion tool performed the following actions automatically for you:
-
The logo and hyperlink were changed to show Sage Enterprise Intelligence and to go to the online help of Sage Enterprise Intelligence instead of Sage Intelligence.
-
The Parameters sheet was changed to bring in Excel all the filters or pass-through parameters if some exist.
-
The hidden Sheet1 was also changed to replace the SI data dump by a dynamic SEI data extraction.
-
-
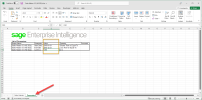
Click the Parameters sheet and enter the values in the filter area.
-
Refresh the data:
-
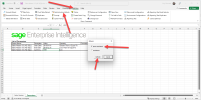
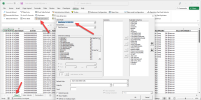
Click the Add-Ins tab from the menu.
-
Click the Data Extraction Refresh button.
-
In the Refresh pop-up, select Entire Workbook. This will refresh the data in the hidden sheets; you may have multiples ones if you got multiple sub-reports.
-
-
Go back in the Sales Master sheet.
-
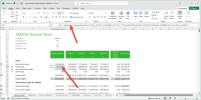
Refresh the pivot :
-
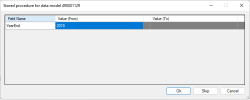
Depending on the report and data model, you may be prompted to enter a value. This happens when the SI report or container was using a pass-through parameter such as this one:
-
Enter the value and click OK.
-
Refresh the pivot as usual. The data is displayed.
-
-
In the $C$5 cell, change the formula to point to the proper cell in the Parameters sheet (instead of the former SI Parameters sheet).
For example: ="For the period from "&""&TEXT(Parameters!D8,"dd mmm yyyy")&" "&"to"&" "&TEXT(Parameters!D9,"dd mmm yyyy"))
-
(Optional) Unhide Sheet1 and click Data Extraction to verify that the data is taken from the new Data Model that was converted from the former SI container.
-
Save your Excel file. From now on, the report will be ready for refresh every time you open it. You can also use this report with the Scheduler in the Web Interface to automatize its distribution.
Example of Demonstration Report Designer S300SQL 1-3
The Demonstration Report Designer S300SQL 1-3 report includes a few formulas that are different from Sage 300 as well as reporting trees.
To make manual adjustments to the Demonstration Report Designer S300SQL 1-3 report:
-
Open the Demonstration Report Designer S300SQL 1-3 in the Output folder.
-
When prompted to authenticate, enter your SEI credentials. Wait for the data to be refreshed.
You will notice that the formula from SI was converted to the SEI formula (necaccess), while keeping all the same filtering options.
-
Change the values in the filter area to view specific data (Company, Year, Period, Currency, Currency Type). The report is refreshed automatically.
-
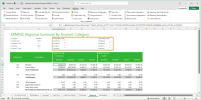
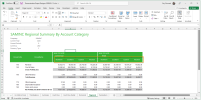
Click the Regional sheet to view an example of reporting tree. The SI reporting tree was changed to use the SEI reporting tree.
SEI shows the reporting tree node description instead of the entire path for greater clarity.
You can change cell F11 (Northern) by the tree node itself (the same applies to G11, H11, etc.). This allows you to get rid of the top section and get the same result. All reporting trees are now directly in the report headers. You can click Reporting Tree Node Selector in the menu options to change them directly from the header. The report looks cleaner and gives the same result.
Financial Report Designer formulas
SEI formulas are based on two SEI data models (Account Summary (SI) and Budget (SI)) for the Financial Report Designer. Formulas are no longer based on the 12 different data dumps coming from the former SI containers (Quantity, Budgets, Open Balances, CurrencyCodes, Settings, FisYrDetail, AccStructure, Account Group, Segments, SegmentCodes, Accounts, Actuals).
As a result, if you made some changes in the original SI data dump (for example: Actuals), you will need to apply these changes in the SEI Account Summary (SI) data model. You have the ability to customize what you want in these data models. However, SEI should give the proper result without any customization.
If one of your reports had a mathematical operation based on the account number (for example: 4000 + 4010), these mathematical operations will be replaced by a mathematical operation on the formula in SEI (for example: =NecAccess(..4000..) + NecAccess(..4010)).
To edit a formula:
-
Go in the cell.
-
Click Formula Wizard from the menu.
-
The wizard shows the list of formulas in that cell. Select the one you want to change.
Conversion table for the Sage 300 formulas
| SEI formula | SEI data model used |
|---|---|
|
glopeningbalance300 |
Formula Wizard on Account Summary (SI) |
|
glclosingbalance300 |
Formula Wizard on Account Summary (SI) |
|
glactual300 |
Formula Wizard on Account Summary (SI) |
|
glactualytd300 |
Formula Wizard on Account Summary (SI) |
|
glbudget300 |
Formula Wizard on Budget (SI) |
|
glbudgetytd300 |
Formula Wizard on Budget (SI) |
|
glaccountdescription300 |
Formula Wizard on Account Summary (SI) |
|
glstructurecode300 |
Formula Wizard on Account Summary (SI) |
|
glcompanyname300 |
Formula Wizard on Account Summary (SI) |
|
gldynamicrange300 |
Data Extraction on Account Summary (SI) |
|
glcurrentyear300 |
Current Year - Must be changed manually in the report after the conversion |
|
glcurrentperiod300 |
Current Month - Must be changed manually in the report after the conversion |
