Scatter and Bubble Charts
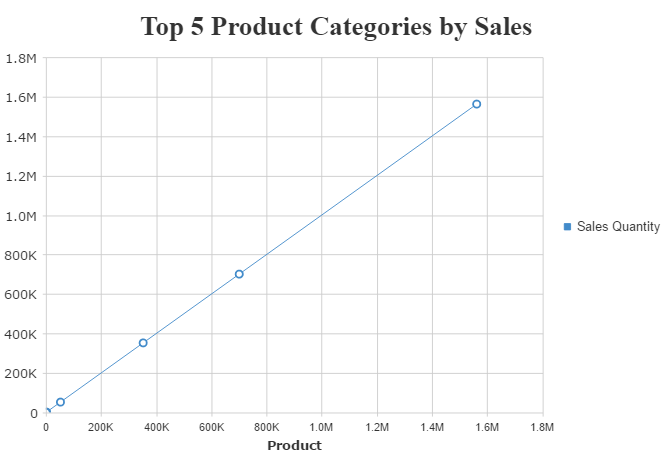
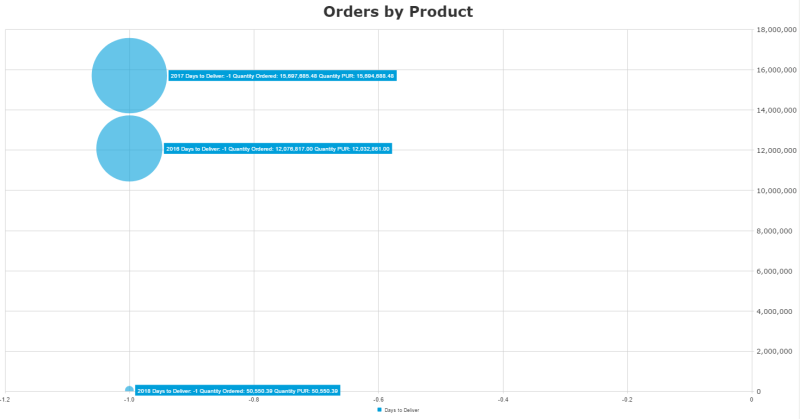
In a Scatter and Bubble chart, the properties allow for associating the X and Y axis values to the magnitude of specific Fields and for the bubble size to be determined by the relative magnitude of a Field. It has the same X axis options as Polar.
|
Series
|
|
|
|
|
|
Bubble size (bubble only) |
To choose the column determining the size of the bubble. |
|
X axis |
To choose the column determining the X axis value. |
|
Y axis |
To choose the column determining the Y axis value. |

