Currency Conversion
The Currency Conversion module converts the reference currency data stored in the UDM Finance cube into reporting currency.
Two types of rates are used to perform currency conversion:
- Average Rate
- Closure Rate
Average Rate allows you to calculate General Ledger transactions with the different rates for each period.
Closure Rate allows you to calculate accounts closing balance for the selected period.
To enter exchange rates:
- In the Data Models and Views tab, expand the Universal Data Model and the Configuration folders.
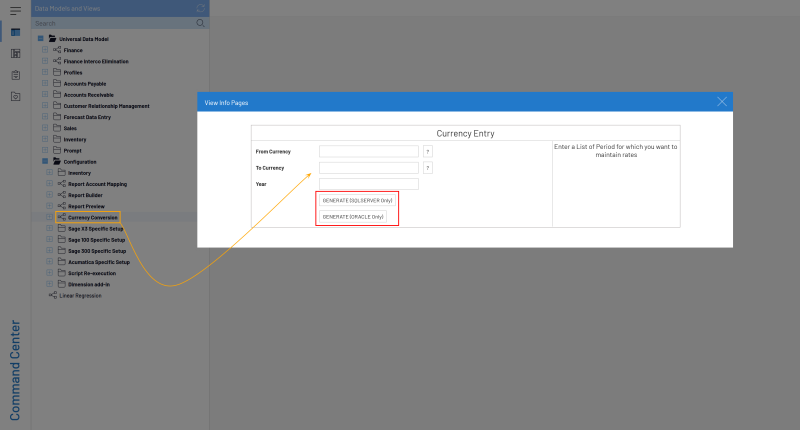
- Right-click on the Currency Conversion data model and select the View Info Pages.
- In the From Currency and To Currency fields, click on the Prompt icon (the question mark) to select the currencies you want to use for the conversion.
- Define a year and click on Generate depending on your server (SQL or Oracle) to finish.
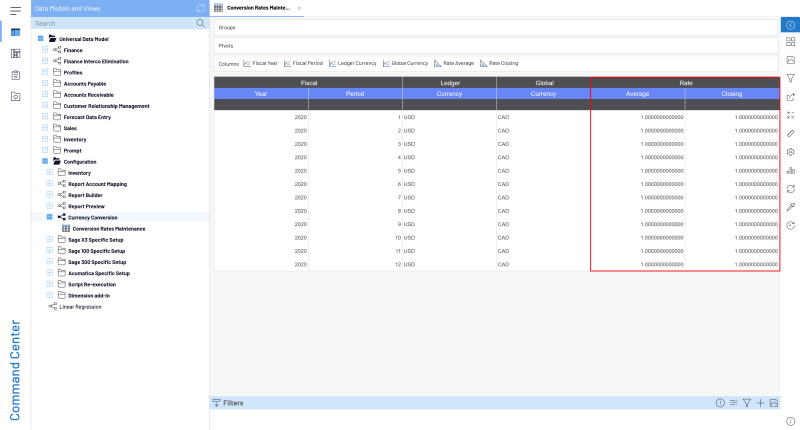
- Under the Currency Conversion data model, open the Conversion Rates Maintenance view.
- In the Average and Closing columns, enter the actual exchange rates for each of these periods and save your worksheet. Here, we defined the Info Page so that we can convert USD to EUR for the periods in the year 2020.
- In OLAP Manager, on the Finance cube, perform a Load All task the first time you enter the rates or a Refresh task if you just need to update. Refer to Manage Cubes List for more details.
If you want to use the reference currency as reporting currency, set the same currency value for the From Currency and To Currency fields (ex: USD to USD) in the Info-Page of the Currency Conversion data model.
Concrete Example
Referring to the source system (the table), we can see that the NA10 Company and FR20 Company have their transaction only in one currency (USD and EUR respectively). Only the NA20 Company has its transactions in two currencies (USD and CAD). In this example, we will apply a two-level conversion by first converting NA10 to Canadian dollars (CAD) then, NA10 and NA20 to Euro (EUR) as EUR is set as the .Global Currency
| Ledger Type | Chart of Account | Company | Ledger Currency |
|---|---|---|---|
| 3 | IFR | FR20 | EUR |
| 1 | NA1 | NA10 | USD |
| 1 | NA1 | NA20 | USD |
| 5 | NA1 | NA20 | CAD |
|
If we have to picture this, let's say FR20 Company owns both the NA20 Company and NA10 Company, and that NA20 Company owns NA10. Since it's the Ledger Currency from FR20 Company which prevails, its currency (EUR) will be set as Global Currency. |

|
As we can see, NA20 Company has transactions with two different currencies (USD and CAD). As USD is the common currency between the NA10 Company and NA20 Company, we will do a USD->EUR conversion and not a CAD->EUR conversion (otherwise no transactions from NA10 would be retrieved, and then taken into consideration for calculations in the FR20 Company).
Converting NA10 currency to CAD
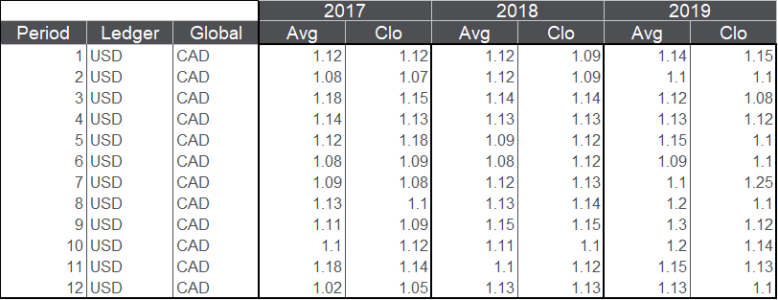
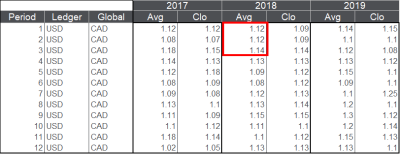
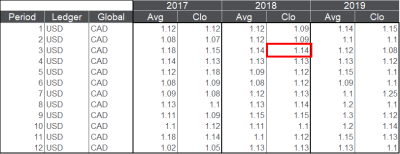
Here are the currency conversion rates we are going to use to convert NA10 to Canadian dollars (CAD).
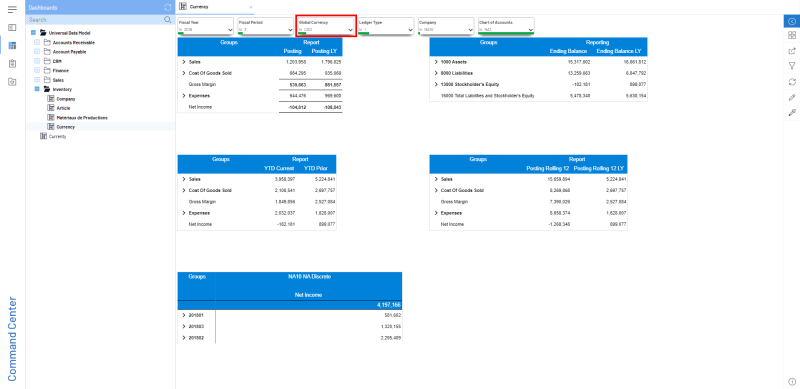
In the following dashboard, there are three Income Statements that present different periods for the year 2018 and a Balance Sheet for the NA10 Company.
The data presented in the following screen use USD as the Global Currency.
We want to convert this data to CAD. In order to do so, we changed the Global Currency to CAD.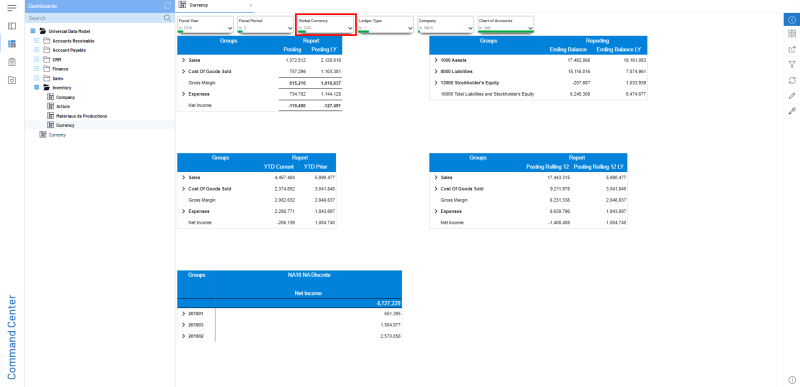
If we compare the Net Income values, we notice they have changed.
This is because SEI uses the currency conversion rates we entered based on the table above to perform the conversion.
| Value in USD | Multiplied by the Currency Rate | Value in CAD |
|---|---|---|

|
|

|
The same applies also to Rolling 12 period.
Converting Balance Sheet currency
To convert Balance Sheet, we use the Closing Rate of the month. If we compare the two Balance Sheets of NA10, one in USD and the other in CAD, we can see that the conversion rate used is 1.14 as described in the currency conversion table for Period 3 of the year 2018.
| Value in USD | Multiplied by the Currency Rate | Value in CAD |
|---|---|---|

|
|

|
Converting KPIs
For the conversion of KPIs, we use Return On Asset. This ratio is calculated as follows: [Net Income Rolling 12] / [Asset] (More calculations are listed in this file. You can also refer to Key Performance Indicators to get more details regarding these operations).
This means the net income of the last 12 months divided by the Assets of the current month.
In order for the ratio to be properly calculated, it will be necessary for each of the twelve months to be converted to their respective Average Rates and for the assets to be converted to the Closing Rate of the actual month.
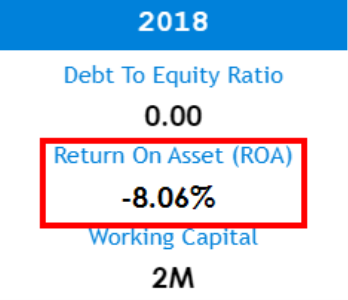
Here is the result in CAD currency of the Return On Assets calculation. This KPI comes from the Chief Financial Officer dashboard.
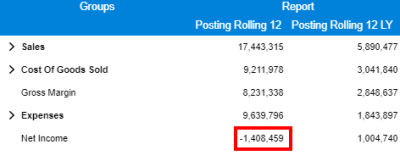
To understand the calculation that has been made, we will start by looking at the Net Income from Rolling 12, i.e. the last 12 months.
Then we divide this amount with the Assets amount.
| Net Income from Rolling 12 | Divided by the Assets | Equal to the Return On Asset Result in % |
|---|---|---|
|

|
|
Consolidating Companies
Finally, we will consolidate NA10, NA20 and FR20 so they can all use EUR as currency.
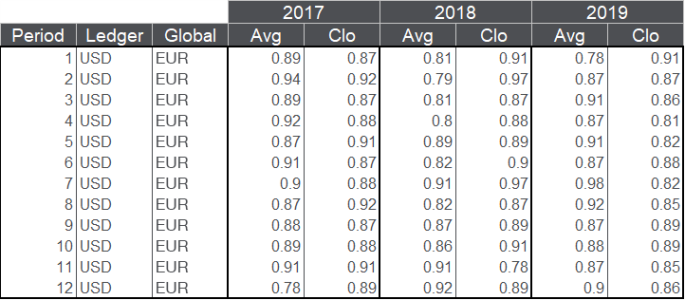
Here is the list of rates used for USD > EUR conversion.
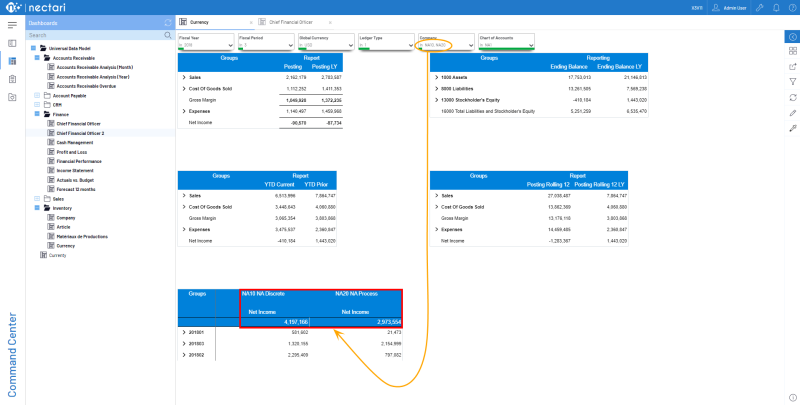
First, we combine the Net Income from NA10 and NA20 in USD.
Then, we change the Global Currency filter to EUR to display the amounts in euro.
Once all amounts are converted, we add the FR20 Company to the Company filter and its Period 3 to the Ledger Type filter to obtain the final result.
