Data Extraction Example
In this example, we will be creating a Web Workbook that will show the Top 5 Customer for a specific Year and Month (based of Sage X3 template) which will then be reflected on a chart.
-
Create a new Web Workbook
-
In cell A1 we will add Year; B1 add the value 2017 (or any year you have data for)
-
In cell A2 we will add Month; B2 add the value 4 (or any year you have data for)
-
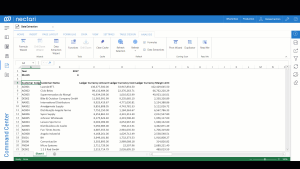
Select the data model Invoice Analysis and name the data extraction SalesReport. We will also select the fields Customer Code, Customer Name, Ledger Current Amount, Ledger Currency Cost, Ledger Current Margin Amount. This will create the output on Sheet1 in cell A4 where the Headers is shown and the Total Row is hidden.
The result is grouped by Customer Code, Customer Name; Ledger Current Amount, Ledger Currency Cost, Ledger Current Margin Amount are set to be aggregated as SUM.
-
Re-open the Data Extraction popup and select the Filters tab. We will add two filters:
-
Year: Select the cell B1
-
Month: Select the cell B2
This will update the existing data extraction definition. Now, change the value of the Month and this will update your data extraction automatically.
-
-
-
Select the Data Extraction and open the Table Design tab. Select the format table you would like to apply.
-
Right-click on the last existing column, add a column to the right. This will add a new column to the data extraction.
-
Change the column header to Margin Percentage. In the first row of the column, add a formula with the column Ledger Currency Cost/Ledger Current Amount.
-
Set the Number Format of the Margin Percentage to Percentage.
-
Set the first row of the Customer Code and Customer Name to bold; Set the Number Format of Ledger Currency Amount, Ledger Currency Cost and Ledger Currency Margin Amt to Accounting.
-
Keep the table selected and click on Refresh Selection under the Analysis Tab.
-
-
Select the table and open the Data Extraction pop. Set the Top X to 5 and click Update.
We will now see the Top 5 Customer for the Year 2017 and Month 4.
-
Select the columns Customer Name and Ledger Currency Amount and click Insert > Chart.
Select the Bar Chart and format it the way you want.
Now we have a visual representation based off of the Data Extraction and will automatically update when the filter is changed.


